Filtering Metrics
In this blog post I want to talk about filters, a feature we've added last month but haven't yet explained/documented to our users. With this new feature, you can fine-tune each metric with more granularity. The filter icon will appear next to the metric name when you hover over that metric, as shown in the image below. There are two types of filters we've added to Investomation:
Rank-Based Metrics
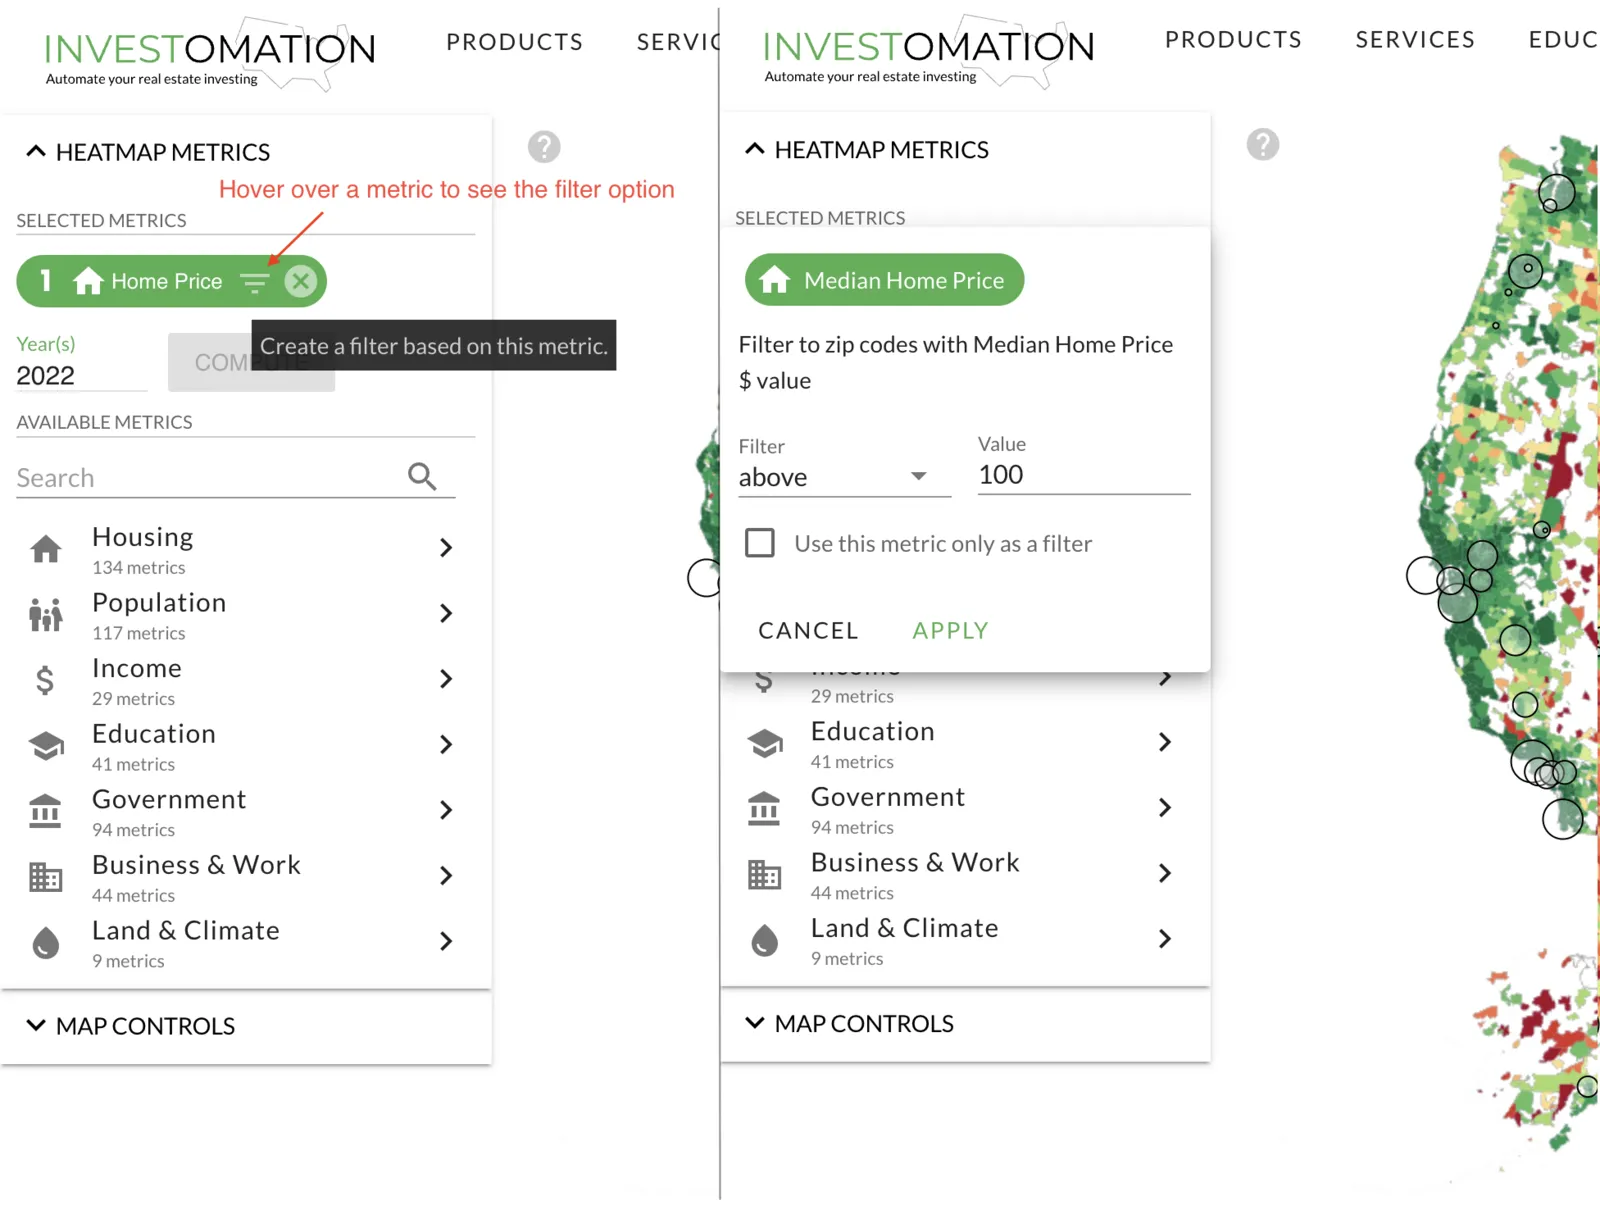 Filters on regular metrics allow you to create a threshold for the metric, filtering out zipcodes based on your chosen criteria. For example, you can choose to filter out zipcodes with a population under 5,000 or a crime rate over 400. This can be especially useful when you want to narrow down your analysis to a specific range or category.
For example, let's say you want to compare a group of neighborhoods all of which are considered A-class. Using metrics without a filter may lump all these neighborhoods into the same percentile/rank. Filtering out B-class neighborhoods and below allows you more granularity between the remaining areas. Another example is stacking multiple filters to iteratively cut off areas that don't meet your investment criteria. Inside the filter, there is also a toggle to use the metric only as a filter. This toggle allows you to use certain metrics as cut-off criteria without using that metric in your ranking. For example, you may want to omit all neighborhoods with population lower than a certain threshold, but don't want population itself to affect ranking of remaining areas.
Categorical Metrics
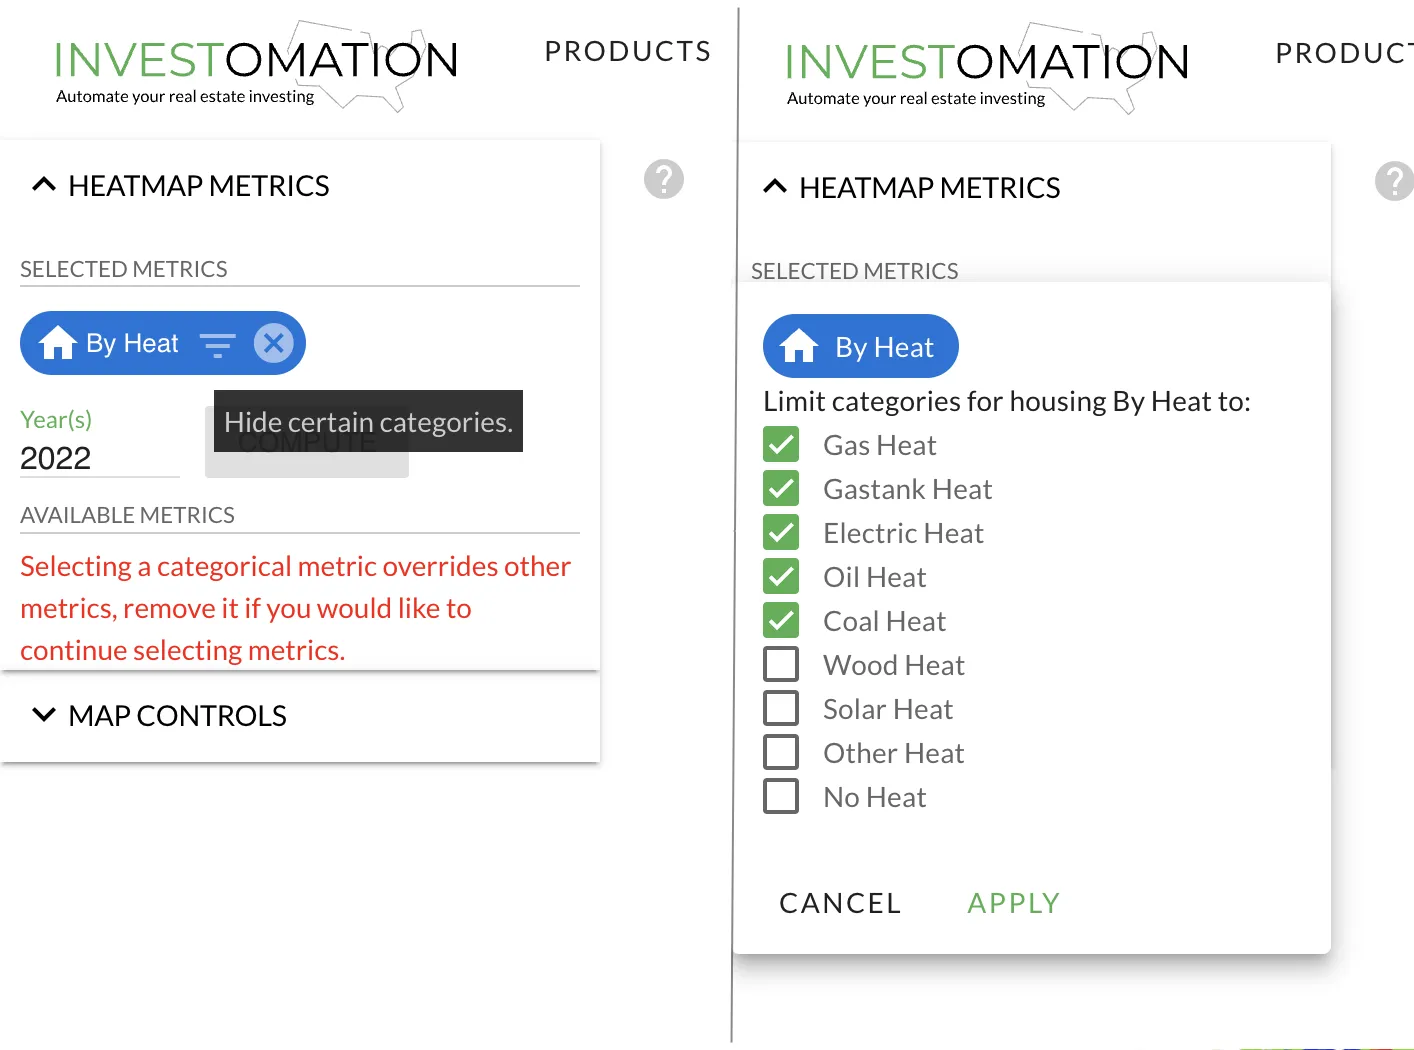 Filters on categorical metrics allow you to hide certain categories from the heat map, allowing you to focus on the most relevant data. For example, if you're comparing most-common sources of heat, you can choose to hide solar energy since it's still relatively rare compared to other heat sources, and just adds visual clutter. If only 2 categories are selected, the heat map will automatically switch to versus mode, which we've already discussed in an earlier article. Instead of color-coding each zipcode area using the winning category,
 versus mode creates a gradient based on the ratio of the 2 categories selected. This allows more granularity when trying to identify trends within each area. For more information and speccific examples, check out the original article on improved category visuals.
We hope you find these new filters helpful in your analysis of zipcodes using Investomation. As always, if you have any questions or feedback, please don't hesitate to contact us. We are always looking for ways to improve our app and make it as useful as possible for our users.
