I Like This Neighborhood, Show Me More Like It
 Every investor eventually finds a neighborhood that works. The numbers pencil out, the tenants are stable, the appreciation trend is solid. The natural next question is: where else can I replicate the same investing strategy? Not "where else is cheap" or "where else has population growth" but rather "where else can I find a similar combination of factors that matter to ME".
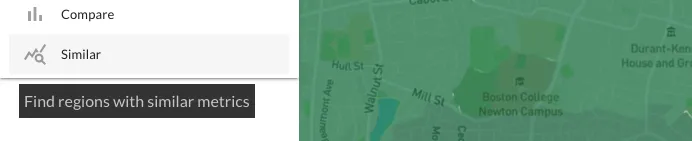
That question used to require a spreadsheet. Export metrics for your target neighborhood, export the same metrics for every other neighborhood in the state, normalize the scales, build a scoring model, sort by similarity. By the time you had an answer, you'd burned through an afternoon and the analysis was already outdated. Investomation now does all of that with a single button:
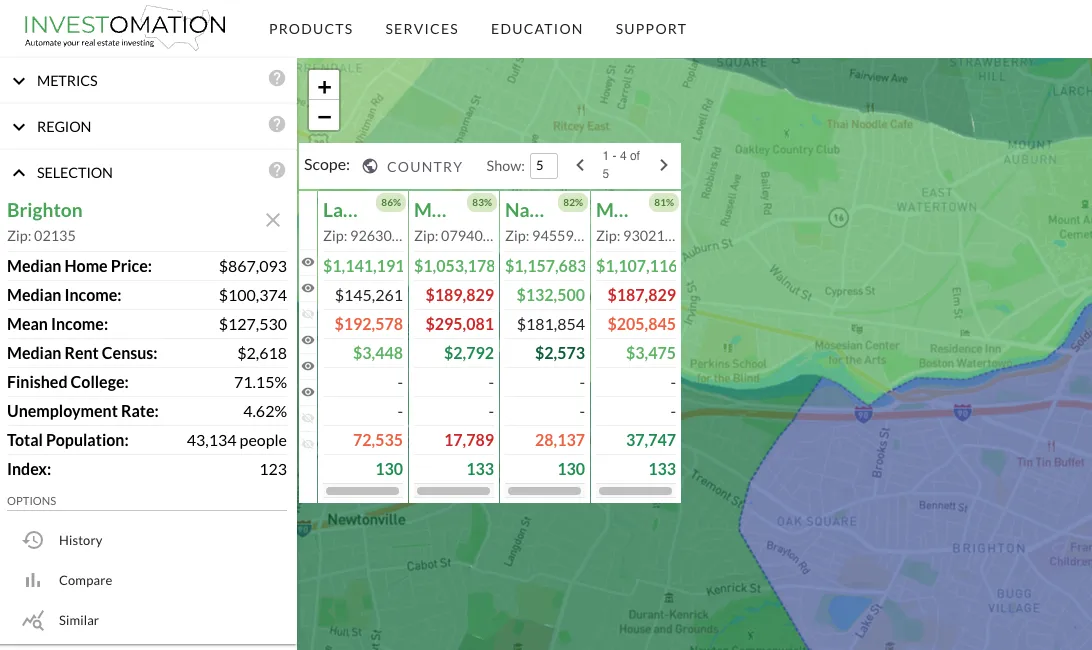
 Select a region, and the panel finds the best matches across any scope you choose: same city, same state, or the entire country. Each match gets a 0-100 similarity score so you can see exactly how close the comparison is.
How the Matching Works
The algorithm uses coefficient of variation for scale-independent comparison. This matters more than it sounds. If you're comparing median home price ($250K) and crime rate (450 per 100K), the raw numbers are on completely different scales. A naive distance calculation would be dominated by whichever metric has larger absolute values. Coefficient of variation normalizes each metric by its own standard deviation, so a 10% difference in home price counts the same as a 10% difference in crime rate. The matching works across units without you having to think about normalization.
The result is a ranked list of regions with similarity scores. A score of 95 means the region's metric profile is nearly identical to your reference. A score of 70 means there are meaningful differences worth investigating. Below 50 and you're looking at fundamentally different markets that happen to share a few surface-level similarities.
Metric Exclusion: Don't Let Noise Pollute Your Results
Not every metric matters for every search. If you care about population density, median income, and rent-to-price ratio but not average temperature or elevation, you can disable the irrelevant metrics. This prevents false positives. Without exclusion, a neighborhood in Phoenix might match one in Minneapolis because they both have similar park acreage and school counts, even though their economic fundamentals are completely different.
Metric exclusion is the difference between "these places look similar on paper" and "these places have similar investment characteristics." The first is trivia. The second is actionable.
Practical Use Cases
Expansion Markets
You run three successful rentals in a neighborhood. The fundamentals are proven: your underwriting assumptions held, your tenants pay on time, your properties appreciate. Now you want to scale. Which other neighborhoods in the state have similar demographics, price points, and rental demand? Find Similar gives you that shortlist without the spreadsheet detour. You're not guessing. You're matching against a proven template.
Undervalued Discovery
This is the use case that gets sophisticated investors interested. Find neighborhoods that match the metric profile of an area that's already appreciating, but haven't seen the same price growth yet. Same demographics, same economic fundamentals, same infrastructure, lower prices. That gap between "similar profile" and "different price" is where opportunity lives. It doesn't guarantee appreciation (nothing does) but it narrows the search to places where the fundamentals suggest the price hasn't caught up yet.
Portfolio Diversification
You're concentrated in one metro. That's a geographic risk. If the local economy takes a hit, your entire portfolio feels it. Find Similar lets you identify regions in other states that have similar investment profiles, so you can diversify geography without abandoning the thesis that's already working. You're not starting from scratch in an unfamiliar market. You're finding markets that behave like the one you already understand.
Franchise Territory Analysis
Corporate franchise models use demographic matching to identify viable expansion territories. They've been doing this for decades with enterprise software that costs six figures annually. Find Similar does the same fundamental analysis: "this territory works; show me others with the same profile." The difference is that it runs on a heatmap you're already using, not a separate GIS platform with a dedicated analyst.
What This Replaces
The manual version of this workflow involves exporting data from multiple sources (Census, BLS, local MLS), normalizing it into comparable units, building a weighted scoring model, and running it across every region in your target geography. That's a real workflow that real investors and analysts perform. Find Similar compresses it into a query that returns results while you're still looking at the map.
The time savings are obvious. The less obvious benefit is consistency. A manual spreadsheet analysis is only as good as the normalization method and weights you chose. Find Similar applies the same algorithm every time, which means the results are reproducible and comparable across searches. When you compare two expansion candidates that both scored 88, you know they were evaluated identically.
