Yield Curve: the Market’s Price Tag on Time
 It’s 8:15 a.m. in New York. A credit officer is staring at two screens. On the left is the bank’s cost of money today: deposits that reprice, short-term funding, anything tied to overnight funding. On the right is the yield curve: the real-time price tag the market is putting on lending money for months, years, decades, with today’s expectations and fears baked in.
In another 15 minutes, the Bureau of Labor Statistics will publish new CPI numbers (a window into today's inflation data) and its periodic jobs report. The Bureau of Economic Analysis will in turn publish its quarterly GDP report. The news will hit like a hammer, moving the market with it.
The yield curve isn’t a niche bond-market object. It’s the benchmark spine of the financial system:
- mortgages
- corporate debt
- student loans
- the discount rate used in stock valuations
- and, most relevant for us, the cost and availability of real estate leverage
The bank’s business model
A bank is constantly doing a simple trade:
- raise money “short” (deposits and short-term funding that reprices)
- lend money “long” (mortgages, business loans, real estate loans that don’t reprice as fast)
When the yield curve is normal, that trade is straightforward. Long-term yields are higher than short-term yields. There’s room to lend, pay depositors, cover losses, and still earn a margin.
But when the curve flattens, that room shrinks. And when the curve inverts, the math turns hostile: short-term money can cost more than long-term lending yields. That’s when banks stop acting generous. They act like risk managers. An inverted curve isn’t just “a recession signal.” It’s a credit behavior trigger.
The history behind the yield curve
Once governments began issuing debt across multiple maturities (weeks, months, years, decades), investors needed a way to compare apples to apples. A “yield” became the common language: what annualized return do I demand to lend money for this long? Economists then built theories around why different maturities yield different amounts. Early yield-curve thinking shows up in Irving Fisher’s and John Maynard Keynes’s work on how expected inflation, real returns, and liquidity preferences shape interest rates across time.
Fast forward to modern markets: the curve is now a core pricing input for basically everything that touches money. The Fed’s staff explicitly frames the yield curve as a tool used for pricing fixed income and as a signal of the expected path of policy and the macro outlook.
Short-term rates vs long-term rates: two clocks, one economy
The front end of the curve (overnight to a few months) is glued to monetary policy. When the Fed tightens, short rates rise quickly. When it eases, they fall quickly. Short rates are “now.” They reflect the current stance of policy, current inflation fight, current restraint.
Long rates (5, 10, 30 years) are the market’s blended forecast of:
- future short rates over many years
- expected inflation over many years
- a term premium - extra compensation for locking money up longer (and taking duration risk)
The long end is not “set by the Fed.” The Fed can influence it, but it’s not a dial. It’s a vote. This is why we can have a world where the Fed is “high for longer” and long rates still fall: the market believes the economy can’t tolerate those highs and cuts are coming.
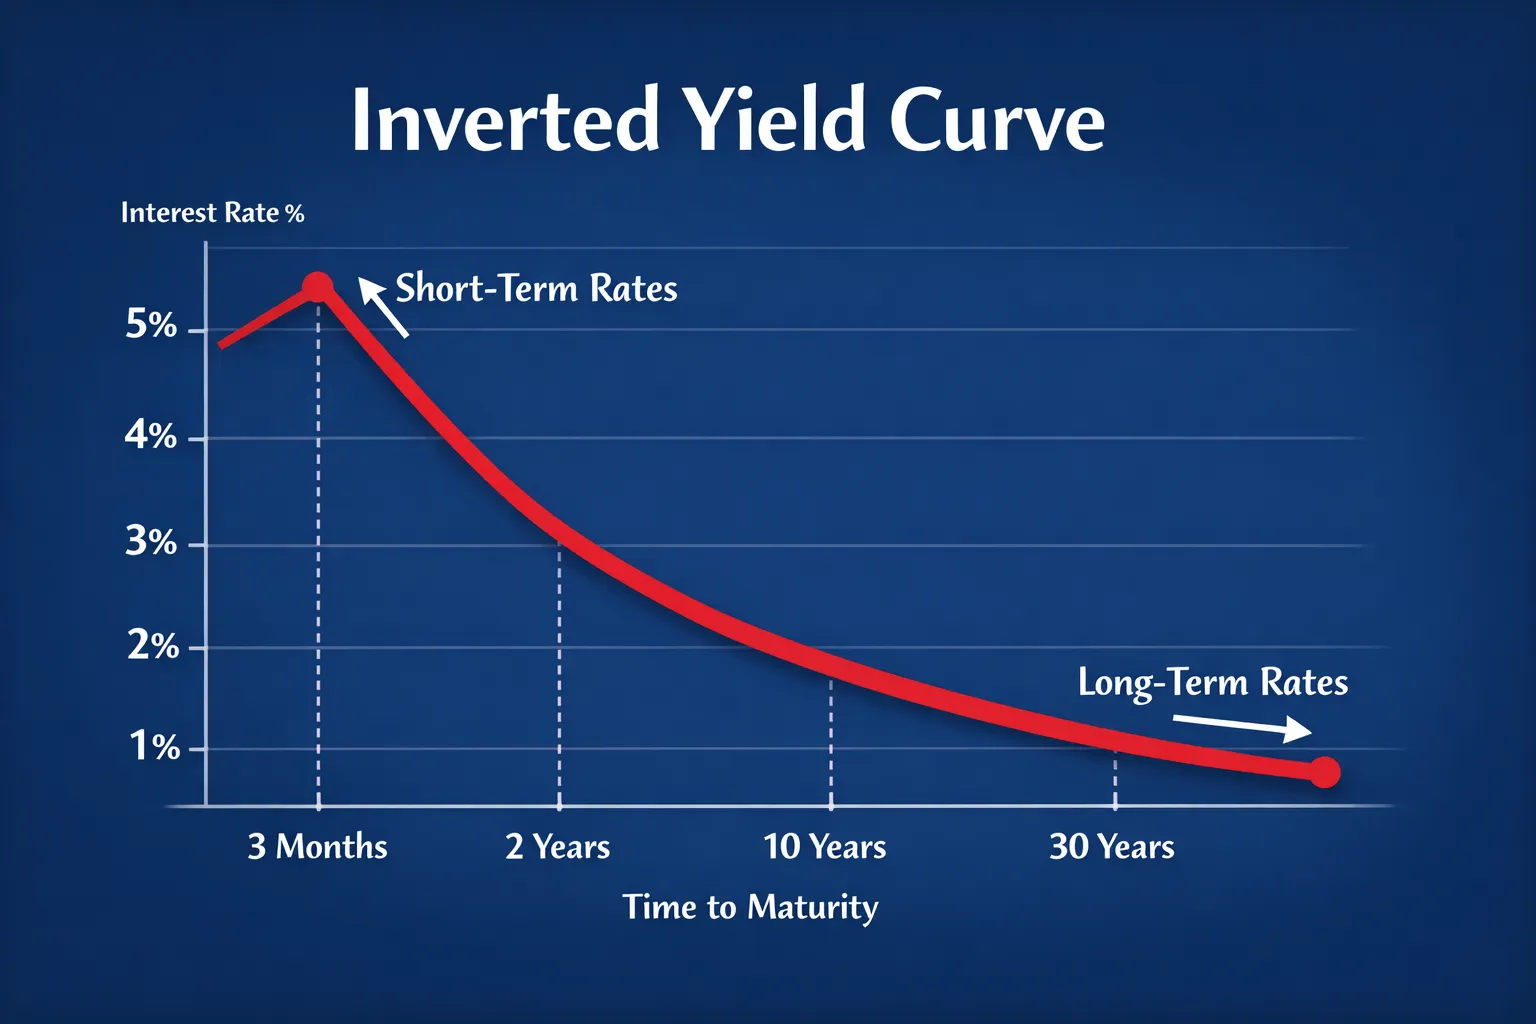
Inversion: when the future pays less than the present
In a typical market, investors expect a higher interest rate when their money is locked up for longer. After all, there is an opportunity cost associated with leaving your money locked. A normal yield curve slopes upward, with short-term yields (bonds) lower than long-term. An inverted yield curve means that short-term rates are higher than long-term. It's a government's way of disincentivizing borrowing - putting the brakes on the economy.
Many investors use the spread between the yields on 10-year and two-year U.S. Treasury bonds as a yield curve proxy and a relatively reliable leading indicator of a recession. The classic recession signal is a negative spread between the 10-year Treasury and the 3-month Treasury bill. Estrella’s New York Fed work popularized this as a forecasting tool and found it performed strongly at predicting recessions two to six quarters ahead. However, the yield curve is not a timing tool, it's a risk regime indicator.
What inversion implies for investors (especially real estate)
1) Banks get squeezed, credit gets pickier
Banks tend to borrow short and lend longer. When the curve flattens or inverts, net interest margins get pressured, which can contribute to tighter lending behavior.
2) Floating-rate debt becomes a silent killer
In inversion regimes, short rates are elevated. If you’re on floating-rate debt (SOFR-based bridge loans, construction loans without adequate hedging), your payment rises immediately. Inversion is also telling you refinancing may get harder before it gets easier, because lenders tighten and valuations reprice.
3) Mortgage rates and cap rates don’t move one-for-one, but the 10-year matters
Mortgage rates are influenced by many things, but the 10-year Treasury is a common benchmark reference point, along with spread dynamics and volatility. When long rates fall while short rates stay high (a classic inversion pattern), you can get this weird split:
- residential mortgage rates may ease somewhat
- commercial credit (especially bank-driven) can still tighten hard
4) The real estate market impact is usually second-order
The curve doesn’t “cause” a RE downturn. A better way to think about it is through the lens of the following cycle:
- inversion → tighter policy / tighter margins → tighter credit
- tighter credit + slowing economy → fewer buyers, lower leverage, more forced sales
- forced sales set comps; comps reprice valuations
Register for free to access the rest of this article w/ a step-by-step yield-curve playbook for real estate investors.
