Delta Metrics
 Investomation is designed to help real estate investors make informed decisions by analyzing multiple metrics simultaneously. By stacking metrics like population, income, crime rate, jobs, and unemployment rate, users generate desirability heatmaps that highlight regions with the highest scores. However, in real estate, the trend often holds greater significance than a metric's current value. For example, job growth is a better predictor of region's future potential than its current workforce.
This is why Investomation has a timeline at the bottom-right, which allows users to change the interval of comparison in order to compare multiple years. You can read more about the timeline in my older blog post.
Previously, one would have to open the timeline to add a delta dimension to all selected metrics at once, so delta was an all-or-nothing adjustment, the user couldn't stack delta versions of some metrics with regular versions of others.
However, there are cases when one does want to stack these. For example, regardless of the crime trend, you still want the crime to be low enough today for your property manager to feel safe there. Crime rate is a perfect candidate to use the current value for. On the other hand, you may be more interested in population growth rather than current population of the area, but you want to incorporate both of these into your heatmap. That's where Delta Metrics come into play.
What's a Delta Metric?
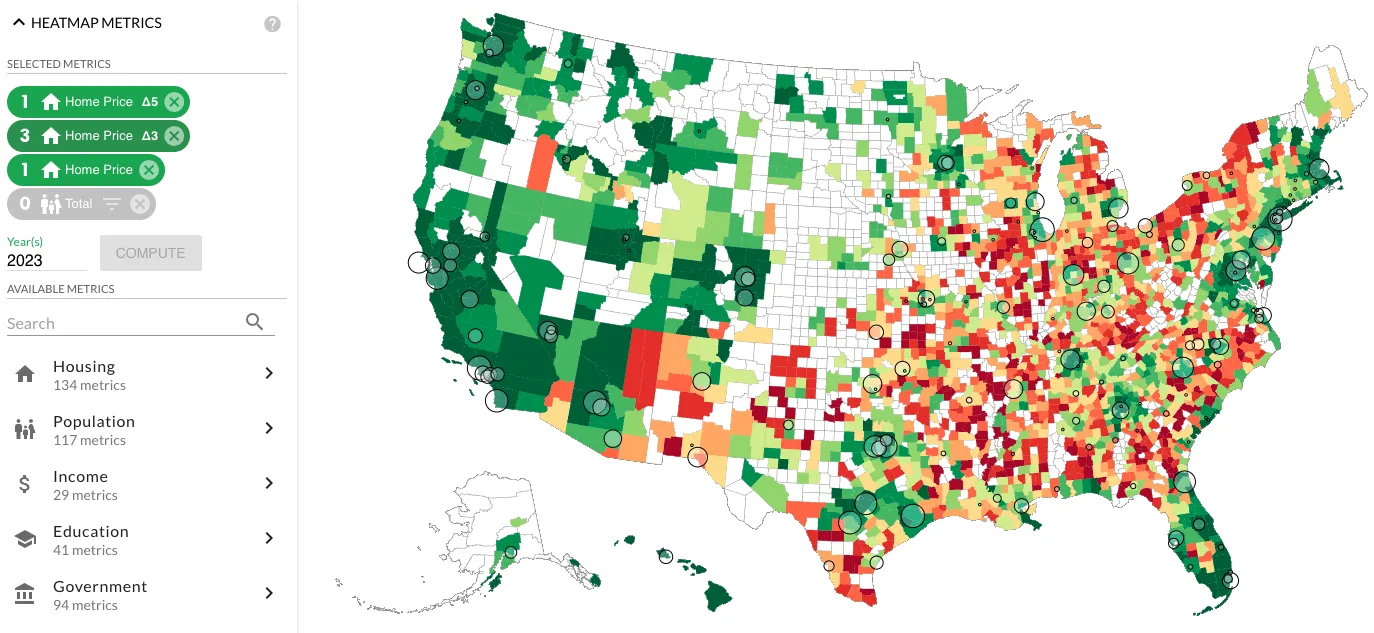
Delta Metric measures percent change over time for the underlying metric in each region, delta duration can be adjusted as needed. For example, a delta of 5 will compare the current metric snapshot against one from 5 years ago for each region. Users can now select desired delta value from the filter menu within the metric to stack both delta versions and regular versions of metrics together (to learn more about the filter menu, see Filtering Metrics article). This enhancement enables a more nuanced analysis, considering both current snapshots and trends simultaneously.
You could, for example, use it to locate areas with job growth, increasing population, and decreasing unemployment, while simulatenaously making sure the area has low crime and house prices you can afford. You could even stack delta and non-delta versions of the same metric, or multiple deltas for the same metric to see if the trend is accelerating or declining.
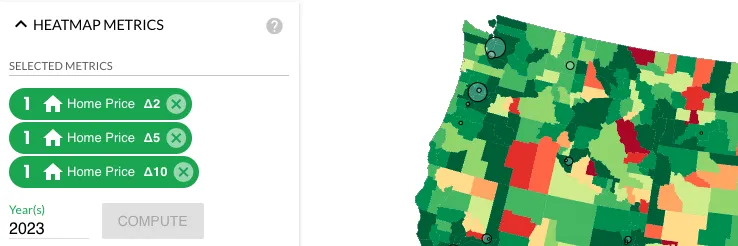
Delta metric is signified with a triangle and a number at the location of the filter icon. The number corresponds to the number of years back to go for comparison. A delta of 2 compares metrics from current year against those from 2 years ago.
