Region and Granularity
In the menu to the left of the Investomation heatmap/chloropleth, under the Region Dashboard section, you'll find 2 parameters controlling the heatmap region: Region and Granularity.
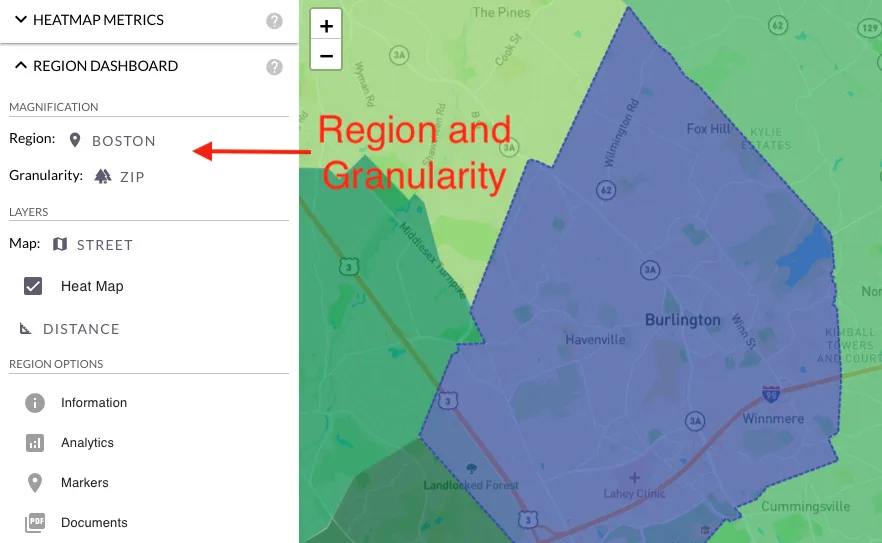
Region controls the area of the map you're currently zoomed in to. This can be a specific city, state, or all of US. The region shown will automatically update as you navigate the map. In the above example, the map is zoomed in to Boston, MA. Clicking this region allows you to change the current location.
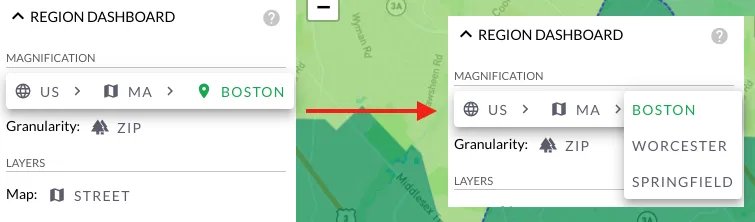
Within the new popup, clicking on the city will allow you to navigate to other cities in the current state, clicking on state allows you to change the state, and clicking on US will zoom out the heatmap back to the country level.
Similarly, clicking on granularity will open up another menu, allowing you to change the size of the granule. A granule is the smallest region on the map for which an individual value of selected metric will be computed.

In the example above, we're using granularity of a zip code. Available granularities change depending on the size of the region. For example, at a country level, where even the zip codes are barely visible, it makes no sense to render individual tracts. With almost 100k tracts, they'll likely crash your browser, or at least slow it down to a crawl. As you zoom in to individual states/cities, more options will appear.
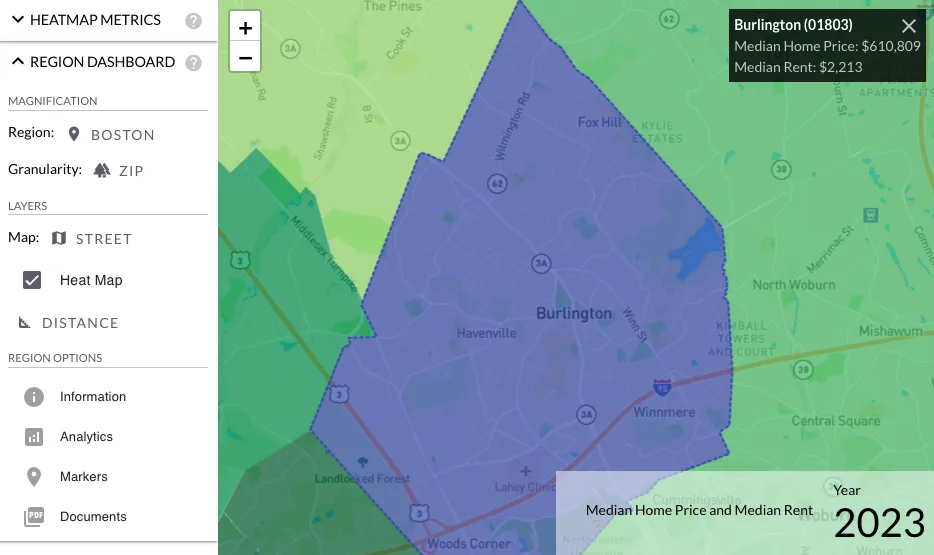
Once you select a different granularity, the map will automatically recompute itself. You can then select individual granules on the map by clicking on them, which will also render a popup in the top-right corner showing the metrics for the selected granule. Note that H3 granulairty has not been implemented yet. However, you'll probably find the Census tract granularity good enough for most use cases.
A census tract represents the smallest territorial entity for which Census gathers information. Other data providers, like IRS and Redfin, typically use granularity of a zip code for their data, which is even more crude. Basically, any provider claiming to have finer granularity than a tract is estimating that data anyway, and from what I've seen, they don't do a good job at it anyway.
Moreover, tracts are typically divided based on geographic and economic factors, as well as population density, so they already incorporate the concept of "pockets" within the neighborhood that many investors search for in their analysis.
The H3 granularity may come in handy at a later date, once we're able to gain more insight into the micro-pockets within the neighborhoods. We're looking at a couple ways for doing so. One approach is to use neural networks to analyze Google Street View data to form a sentiment of area desirability. The other approach would be a combination of direct mail campaign and cryptocurrency to incentivize locals to provide more granular feedback about the region they live in. We already have a way to solicit feedback via document forms, a concept I explained in more detail in the blog post that talks about markers. Direct mail campaign could be used to drive relevant traffic to this page and cryptocurrency to create a financial incentive for information providers to participate.
