Share Your Research Without Sharing Your Account
 Real estate research lives in PDFs and slide decks. Someone spends an hour building a heatmap, comparing crime trends across neighborhoods, placing markers on target properties, then screenshots the result and pastes it into a document. The recipient gets a flat image. They can't click a neighboring zip code to see how it compares. They can't pan west to check what's happening across the highway. They can't hover over a tract to read the actual numbers. A screenshot of a heatmap is like printing a single frame from Google Maps and mailing it. You've captured one angle of something that was built to be explored from every angle.
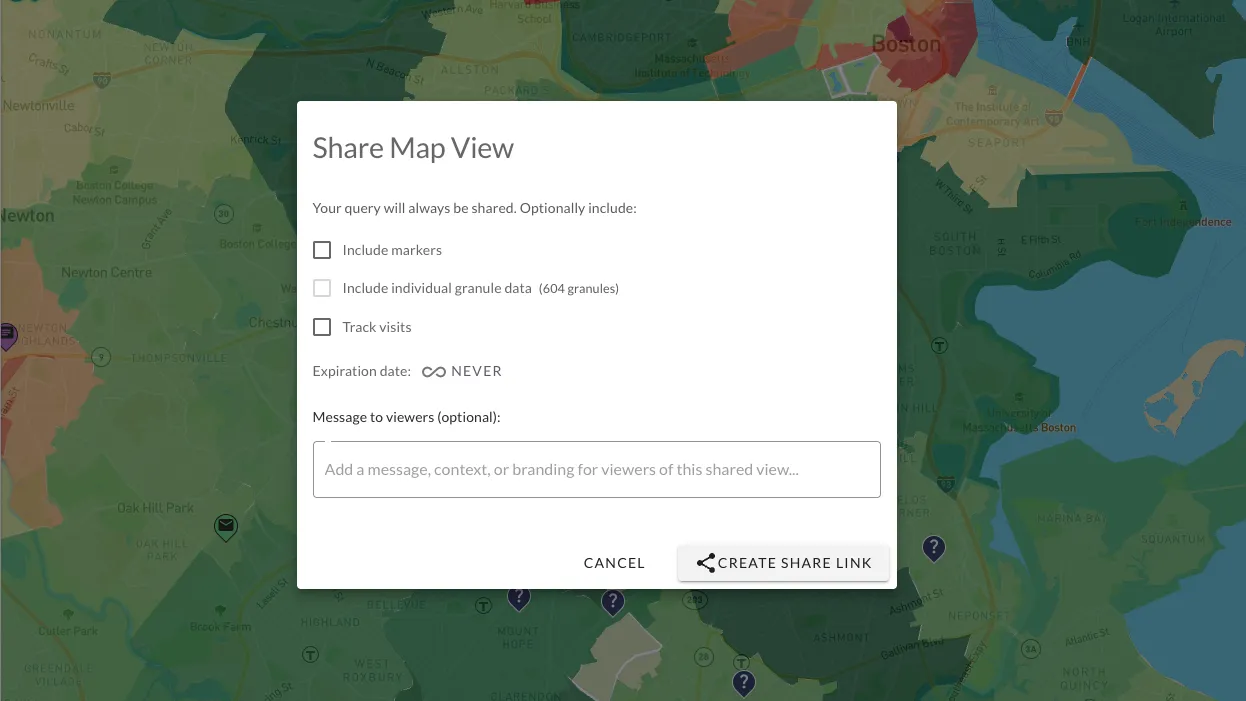
Investomation's shareable view gives you a link instead of a screenshot. The recipient opens it and gets the full interactive experience: the heatmap, the analytics panel, the markers, the ability to click into neighboring regions and see their data. It's a multi-dimensional snapshot. The selected year and metrics stay fixed to exactly what you chose, but the interactivity is fully intact. If the Census later corrects an error in the underlying data, the view reflects that correction, so the research stays accurate even if you never touch it again.
The typical real estate professional juggles multiple tools for research and multiple tools for communication. Zillow for comps, Census data for demographics, Google Maps for proximity, then PowerPoint to package it all. Shareable view collapses that last step entirely. Instead of translating your research into a presentation format, you share the research itself.
This changes the nature of the conversation. When I send a client a shareable link instead of a PDF, they're not passively reading my conclusions. They're exploring the same data I used to reach those conclusions. They can hover over neighborhoods, compare metrics, inspect markers. The research becomes a shared experience rather than a one-way pitch.
Use Cases by Role
Real Estate Agents
Instead of telling a client "trust me, this neighborhood scores well," send them the research. The client sees the actual heatmap, the actual metrics, the actual comparison. That changes the dynamic from "take my word for it" to "see for yourself." Agents who use data to back their recommendations close faster because the client isn't just trusting the agent's gut, they're verifying it independently.
I've seen agents embed shareable links directly in listing presentations. The link sits alongside the property photos and the comp analysis, but unlike a static comp sheet, the heatmap link lets the buyer explore the surrounding area on their own time. That extra layer of transparency builds trust in a way that polished marketing materials never will.
Wholesalers
Wholesalers live and die by their buyer list. The standard pitch is a spreadsheet of addresses with ARV estimates and repair costs. A shareable view turns that spreadsheet into something visual. Each marker is a property with attached research, the buyer can see exactly where each deal sits relative to crime, income, population trends, whatever metrics matter for their strategy. Buyers can evaluate deals on their own time instead of sitting through a pitch call.
Offer Memorandums and Lending Packages
If you've ever put together an offer memorandum for a syndication or a lending package for a commercial deal, you know the pain of the "market analysis" section. It's usually a collection of screenshots from various sources, half of them outdated by the time the document is finalized. A shareable link replaces that entire section with a single URL that stays current. Lenders and partners see the market analysis without you having to export screenshots that go stale.
Airbnb Hosts and Direct Bookings
This one is less obvious but genuinely useful. Airbnb hosts who want to encourage direct bookings (bypassing Airbnb's fees) can create a shareable view showing their rental listings on the map, complete with area highlights and nearby attractions. Send the link to repeat guests with a note: "book direct next time, here's what's available." The map becomes your own booking interface, showing your properties, the surrounding area, and why the location matters.
Franchise Operators and Business Brokers
Business brokers use the same offer memorandum workflow described above, except for commercial deals. Franchise operators evaluating territories get a map they can explore instead of a static PDF. Corporate development teams can compare territory analyses side by side by opening multiple shareable links.
The Locked Metric Set
One of the less obvious features is that shared views lock the recipient to a specific metric set and region. At first glance this sounds like a limitation. It's actually the most important feature for professional use.
When a broker shares research with a client, they're curating a narrative. If the strategy is cash flow in B-class neighborhoods, the broker wants the client to see population growth, median rent, crime trends, and employment data. They don't want the client wandering into environmental hazard metrics or political demographics and getting distracted from the investment thesis. The locked metric set means the sharer controls what's visible, focusing on the metrics that matter for the exact strategy and eliminating noise.
This is particularly useful for agents working with out-of-state investors who might not know which metrics are relevant to a given market. Instead of overwhelming them with everything, you show them exactly what matters.
Permanent Links as Marketing Collateral
You choose whether a link expires or lives forever. Permanent links become marketing collateral. Embed them in your website, your email signature, your listing presentations. An agent could maintain a "market research" page on their website that's just a collection of shareable Investomation views for the neighborhoods they specialize in. That's a differentiator that no amount of Canva templates can replicate.
Expiring links serve a different purpose: time-sensitive deals. If you're shopping a wholesale deal or a syndication opportunity with a deadline, you might not want the research floating around indefinitely after the deal closes. Set an expiration and the link goes dark when the window shuts.
Branding the Experience
When someone opens your shareable link, the first thing they see is your name and a message you wrote. You control the greeting. It might be a one-liner introducing the research: "Here's the market analysis for zip codes 30308–30312 we discussed." It might pitch your services: "I put together this comparison for you. If you want a deeper dive into any of these neighborhoods, here's how to reach me." Either way, the recipient knows who sent it and why.
This matters because the alternative is anonymous data. A screenshot pasted into an email has no author. A PDF attachment gets separated from the email that explained it. A shareable view keeps your name attached to the research at the point of consumption. The person exploring the heatmap sees your branding while they're engaged with the data, not before or after in a separate message they might not read. For agents and brokers building a reputation around data-driven advice, that's the difference between "someone sent me a map" and "my broker sent me this research."
Visit Tracking
Shareable links include basic visit tracking. You can see when and how many times your link has been opened. This is a small feature with outsized practical value. If you sent an offer memorandum on Monday and the link got opened 12 times by Thursday, you have a signal. If it hasn't been opened at all, that's a different signal. Either way, you're not guessing whether your prospect even looked at the research.
What This Changes
Before shareable views, Investomation was a personal research tool. Powerful, but personal. You did your analysis, formed your conclusions, and then had to figure out how to communicate those conclusions through some other medium, a slide deck, a phone call, a spreadsheet export.
Shareable views turn the research itself into the deliverable. The gap between "I analyzed this market" and "here's what I found" shrinks to a single click. For investors who work with clients, partners, or lenders, that's not a convenience feature. That's a workflow change.
