State Metrics Added
 A while ago I added the concept of granularity to Investomation. Granularity selector now allows one to switch between different region sizes and automatically recomputes the metric as needed. It was tricky due to the logic involved, and I had to get the region overlaps just right to avoid errors. It took me a few iterations to get right. But now that it works, I have the ability to compute these metrics on state level as well, something the UI was not taking advantage of until today.
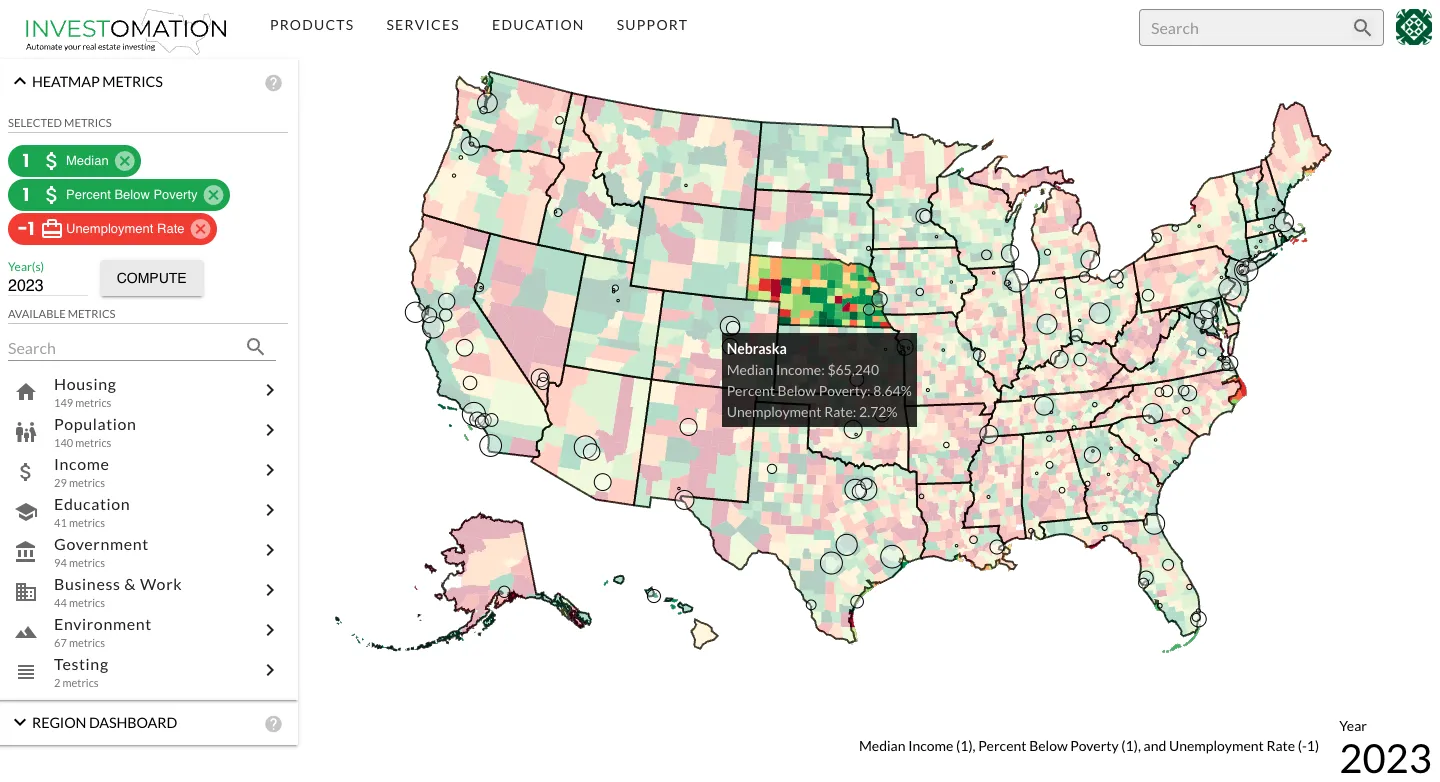
Previously, the county-level map was limited to showing current population and population change since 2010, but now you can see all the metrics on the country level as well. As you hover over individual states on the US map, you will see aggregated state values for the metrics you have selected.
I'm also thinking of making this data accessible through region dashboard, which would show US-level calculations for each metric while zoomed out, and state/city level calculations while zoomed in.
