Why the 30‑Year Mortgage Tracks the 10-Year Yield
 As the Fed reversed policy and started lowering rates, the lenders have been slow to react. Most real estate investors who have been doing this for a while are aware that the 30-year mortgage tracks closely to the 10-year U.S. Treasury yield, but why is that the case? Let's first unpack what each one represents.
The Fed Funds Rate vs. the 30‑Year Mortgage
The federal funds rate is the interest rate banks charge each other for overnight loans. It’s a short‑term policy instrument, and its changes ripple quickly through short‑term borrowing costs, such as credit‑card rates and one‑year Treasury bills. In contrast, a 30‑year mortgage is a long‑duration loan; lenders must lock up capital for decades and are exposed to inflation, future interest rates and prepayment risk. These risks have little to do with last night’s borrowing cost.
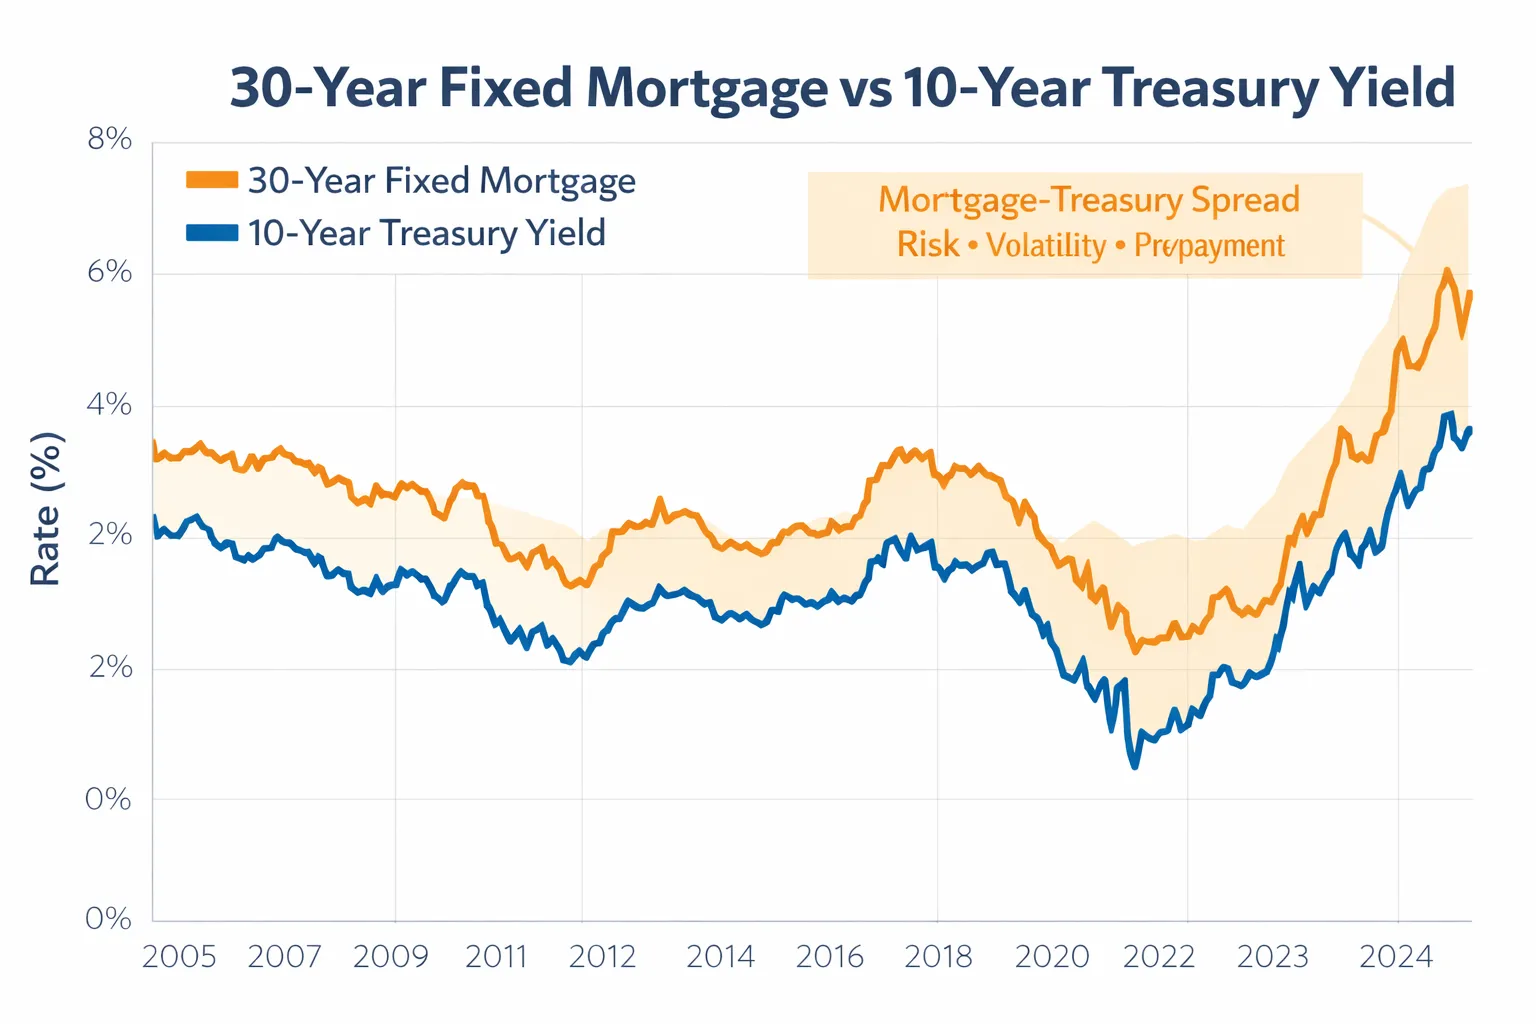
A 2017 Federal Reserve analysis highlighted this disconnect: the 10‑year Treasury yield does not move closely with the fed funds rate. Instead, long‑term rates reflect expectations of future short‑term rates plus a term premium. When you plot the 30‑year mortgage rate against the 10‑year U.S. Treasury yield, they move in tandem over decades.
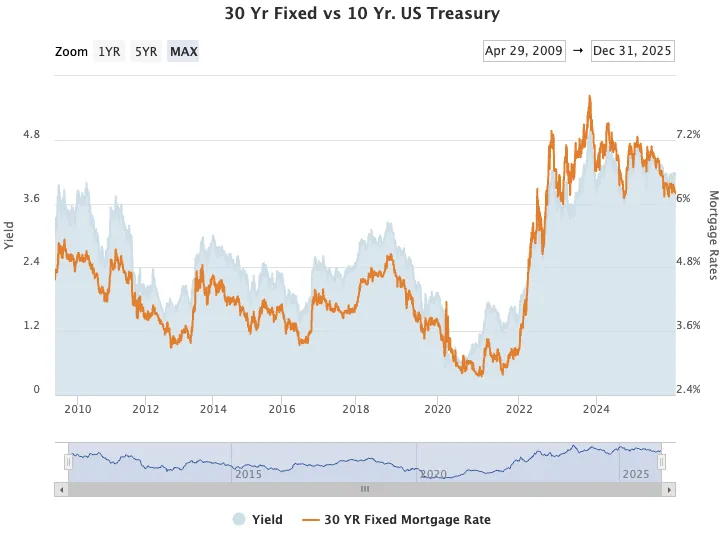 Mortgage rates typically sit about 1½ to 2 percentage points above the 10‑year yield to compensate lenders for credit risk, servicing costs and the possibility that borrowers refinance. This spread is not fixed - it widens during recessions because falling yields encourage refinancing and shorten the expected duration of mortgage pools.
Why the 10‑Year Note is the Right Proxy
- Duration matching. A 30‑year fixed mortgage seldom lasts 30 years. People sell, refinance or move. Historically, the average mortgage lasts about 7‑10 years. Bond investors therefore compare mortgage‑backed securities (MBS) to the 10‑year Treasury, the risk‑free asset with a similar expected maturity. Lenders price mortgages so that the yield offered to MBS investors remains attractive relative to the 10‑year note.
- Risk premium. Mortgage rates incorporate two spreads: a primary–secondary spread (originator profits, servicing and overhead) and a secondary spread (credit and prepayment risk). These spreads sit on top of the 10‑year yield. During calm markets, spreads compress; in stress, they blow out.
- Fed policy vs. market expectations. Long‑term yields are driven by expectations about future inflation, fiscal policy and economic growth. When the Fed raises short‑term rates to fight inflation, long‑term yields may rise if investors fear inflation will remain high; or they may fall if investors believe the Fed will succeed quickly. That’s why mortgage rates sometimes increase when the Fed cuts or decrease after a hike – investors are repositioning around expectations, not the headline rate.
These dynamics explain why the Fed’s policy rate and 30‑year mortgage rates sometimes diverge dramatically. In late 2023, for example, the Fed funds rate hovered around 5.5%, yet 30‑year mortgages exceeded 7.5%. The gap reflected a combination of elevated 10‑year yields and wider mortgage spreads due to an inverted yield curve.
Yield Curve and Mortgage Spreads
A yield curve plots the yields of similar credit‑quality bonds across maturities. In a “normal” environment the curve slopes upward – longer maturities carry higher yields – signalling economic expansion. An inverted curve slopes downward and often precedes recessions. The curve matters because it changes the expected duration of mortgages. When the curve is steep (upward‑sloping), current rates are low relative to future rates, so borrowers are less likely to refinance quickly; mortgages behave like long‑duration assets and align with the 10‑year Treasury. When the yield curve inverts, borrowers expect rates to fall and are more likely to refinance soon. Mortgages behave more like short‑duration assets, and their rates align with shorter‑term Treasuries, widening the spread over the 10‑year.
Grey Gordon of the Richmond Fed coined this phenomenon the “mortgage duration effect.” During economic stress, an inverted yield curve reduces expected mortgage duration; lenders therefore price mortgages closer to the 2‑year Treasury. That’s why mortgage spreads tend to blow out in recessions.
How the Fed Influences Mortgage Rates
The Fed influences mortgage rates indirectly through two channels:
- Expectations and signaling. By raising or lowering the fed funds rate, the Fed signals its view on inflation and economic strength. Those signals shift expectations across the yield curve. If the Fed signals persistent inflation, long‑term Treasury yields may rise, pushing mortgage rates higher; if it signals a coming recession, long‑term yields may fall, lowering mortgage rates.
- Quantitative easing / tightening. During crises, the Fed buys or sells Treasury and mortgage securities to inject or withdraw liquidity. Heavy Fed purchases of MBS (as in 2020–2021) compress mortgage spreads; unwinding those positions widens spreads.
Even when the Fed cuts rates aggressively, mortgage rates can rise if inflation expectations or Treasury issuance push long‑term yields up - this occurred in mid‑2024 when the Fed paused hikes, yet mortgage rates remained near 7% because the 10‑year yield spiked on fiscal concerns.
Other Loan Types: Which Benchmark Fits?
Not all loans are benchmarked to the 10‑year. The index depends on the loan’s expected duration and risk profile.
Adjustable‑Rate Mortgages and HELOCs
Adjustable‑rate mortgages (ARMs) and home‑equity lines of credit (HELOCs) reset periodically, so their rates are tied to short‑term benchmarks. Historically, this benchmark was the prime rate or LIBOR; today it’s often SOFR (Secured Overnight Financing Rate). Bankrate notes that most ARMs’ interest rates are “directly connected to SOFR” and thus closely follow Fed moves. When the Fed hikes, monthly payments on ARMs and HELOCs rise almost immediately.
Multifamily and Commercial Mortgages
Commercial real estate (CRE) loans are typically shorter (5, 7 or 10 years) with amortization periods of 20–30 years and a balloon payment at maturity. These loans are priced off a benchmark index plus a spread, where the index is often the 5‑, 7‑ or 10‑year Treasury for fixed‑rate loans, SOFR or the prime rate for floating‑rate loans, or a swap rate for CMBS and life company loans. For example, Fannie Mae’s Hybrid ARM for small multifamily loans fixes the rate for seven or ten years based on the 7‑ or 10‑year Treasury and then converts to an adjustable rate tied to 6‑month LIBOR. Because these loans are shorter than 30‑year residential mortgages, their benchmark aligns with their fixed term.
A Terrydale Capital primer points out that commercial mortgage rates reflect long‑term Treasuries (5‑, 7‑ or 10‑year) rather than the Fed’s overnight rate. Lenders add a spread for loan‑to‑value (LTV), debt‑service‑coverage ratio (DSCR), property type and credit risk. Even if the Fed cuts rates, commercial mortgage rates may not fall if the 10‑year Treasury yield rises due to inflation expectations or increased Treasury supply. The same article notes that markets anticipate Fed moves; rates often adjust before the Fed.
Balloon and Shorter‑Term Loans
Many bank loans and private‑money mortgages are structured with a 3‑, 5‑ or 7‑year balloon. These products usually benchmark to the corresponding Treasury yield (e.g., the 5‑year Treasury) plus a spread. Because the lender’s exposure ends at the balloon date, there’s no reason to price against the 10‑year. As with multifamily loans, a shorter index better matches expected duration and risk. Floating‑rate bridge loans might reference SOFR or the prime rate, resetting monthly.
Bringing It All Together
Once you understand duration and risk, the logic of mortgage pricing becomes clear:
- 30‑year fixed mortgages price off the 10‑year Treasury, not the fed funds rate, because the expected life of a mortgage is much closer to 10 years and investors require a term premium to bear inflation and prepayment risks.
- Adjustable‑rate mortgages and HELOCs follow SOFR or prime, moving with Fed policy almost immediately.
- Multifamily and commercial loans benchmark to the 5‑, 7‑ or 10‑year Treasury, SOFR, or swap rates, depending on their fixed term and whether they’re floating or fixed. Lenders add spreads based on property type, leverage and market conditions.
- Yield curves and spreads matter. A steep curve anchors mortgages to long‑term Treasuries. An inverted curve shortens mortgage duration and drives spreads up, making mortgage rates unusually high relative to the 10‑year.
- The Fed’s role is indirect. It sets short‑term rates and signals its future path, which influences long‑term yields and therefore mortgage rates. But it cannot unilaterally lower 30‑year mortgage rates if inflation expectations or fiscal dynamics are pushing up the 10‑year.
