Concierge Case Study #1: Comparing Charlotte Submarkets (Part 2)
Series: Concierge Case Study #1 (Charlotte STR)
- Part 1: Reading the Market
- Part 2: Comparing Locations (you are here)
- Part 3: Renovating for AirBnB
- Part 4: Six Months In (coming soon)
 Part 1 walked through the first Charlotte property we underwrote for the client. Day two we ran the same analysis on a second property the client found within our partner network, in a different part of Charlotte, and the side-by-side ended up driving the recommendation. This post walks through Property B and the comparison that came out of it. The end of the post lays out the full concierge process from acquisition through management for anyone who wants the work run for them rather than learning it screen by screen.
Same anonymization rule as before: I'll call the second candidate Property B, leave the tract IDs and numbers in.
Property B: zipcode-level read
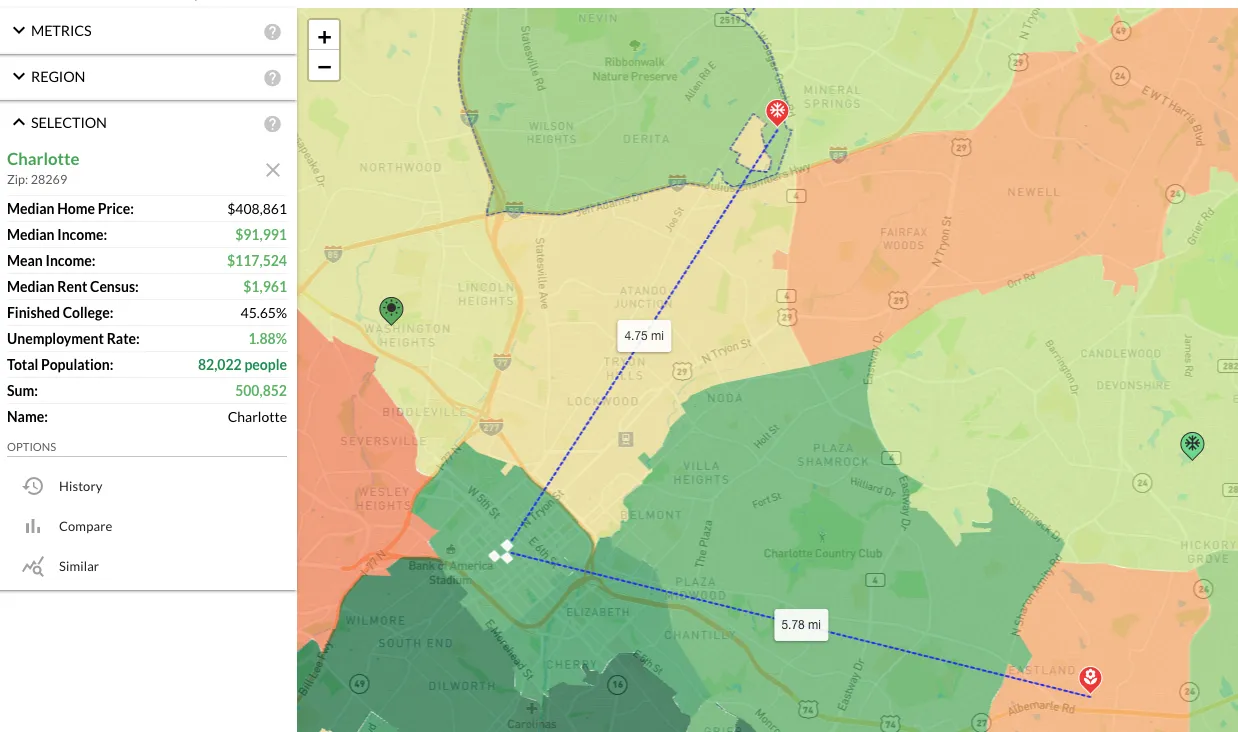
Property B sits in the 28269 zipcode in north Charlotte, closer to UNC Charlotte and the University City employment cluster. It's 4.75 miles from downtown vs. Property A's 5.78, but the difference in actual character is much bigger than a one-mile delta suggests. The zipcode reads $91,991 median household income, $117k mean, $408k median home price, 45.6% college-attainment, across roughly 82,000 residents in 30.6 square miles.
Cross-checking that income figure against public sources requires understanding how ACS reports. Census Reporter shows 28269 at $81,517 and city-data shows $83,285, both drawing on the 2020-2024 ACS 5-year release. That release is a rolling 5-year average centered on mid-2022, so in a market where incomes are growing the headline number is structurally 2-3 years stale. The same ACS series shows 28269 grew from $65,963 in the 2015-2019 release to $81,517 in the 2020-2024 release, a 24% increase on the smoothed average and roughly 4.4% per year. Census uses a 5-year average for small geographies to reduce statistical noise, which understates the trend in fast-growing regions.
Projecting from the 2022 midpoint forward to 2025 at that same growth rate lands around $93k. Our $91,991 sits in that band, which is the expected result for a forward-projected estimate in a corridor that's still appreciating. The ranking holds either way: 28269 is materially higher-income than Property A's zipcode.
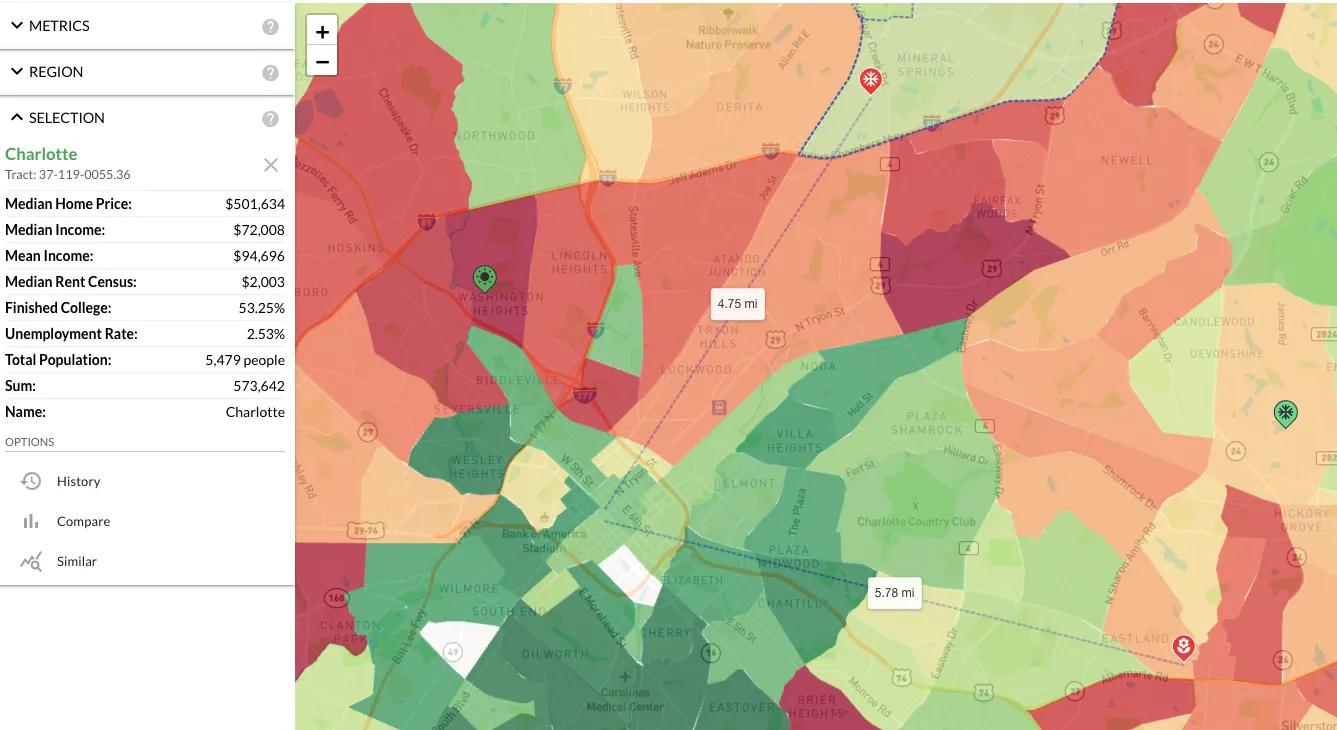 At tract level (37-119-0055.36) the picture cools off relative to the zipcode: $72k median income, $94k mean, $501k median home price, 53% college-finished. Tract median home price coming in higher than the zipcode median is something I look for. It signals the tract is a higher-end pocket inside a broader middle-class zipcode.
Demographics
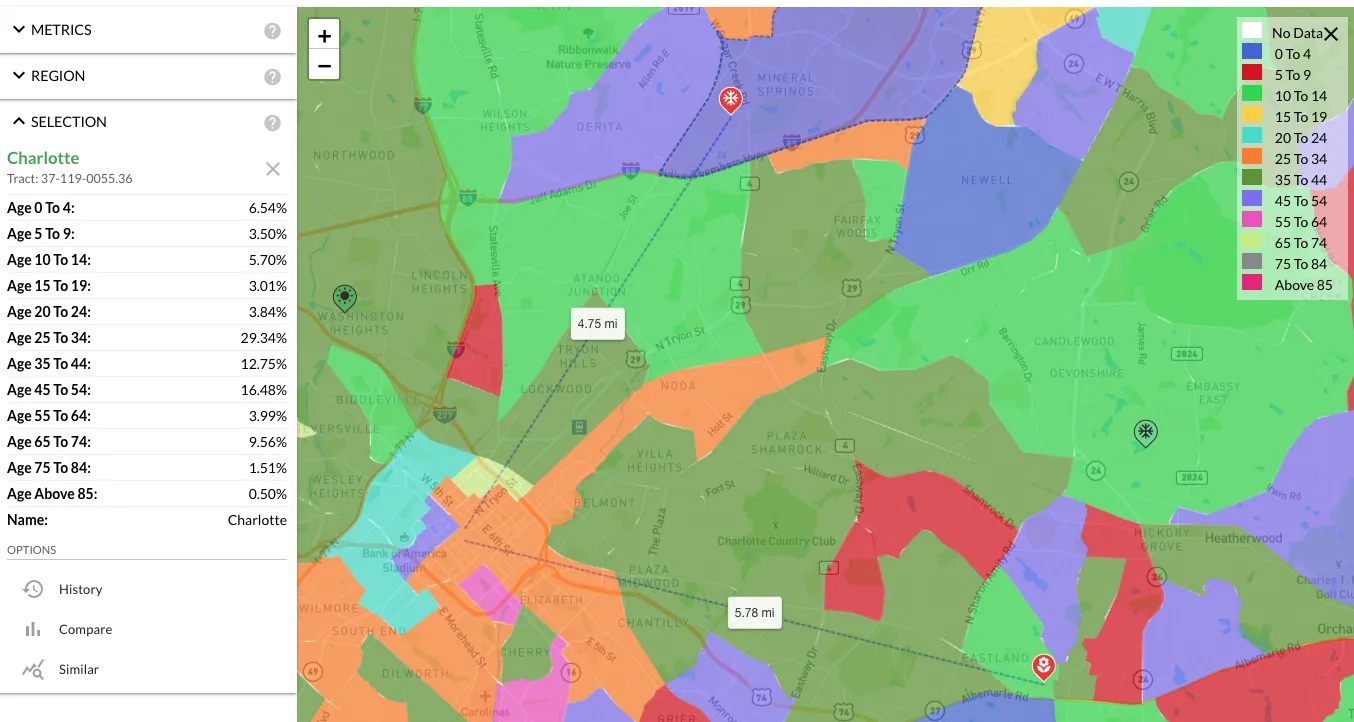 Age skew here looks similar to Property A: 30% in the 25-34 range, 13% 35-44, 16% 45-54. Family formation cohort plus an established middle-aged segment. Slightly older skew than Property A overall, which generally correlates with quieter neighborhoods and fewer noise complaints.
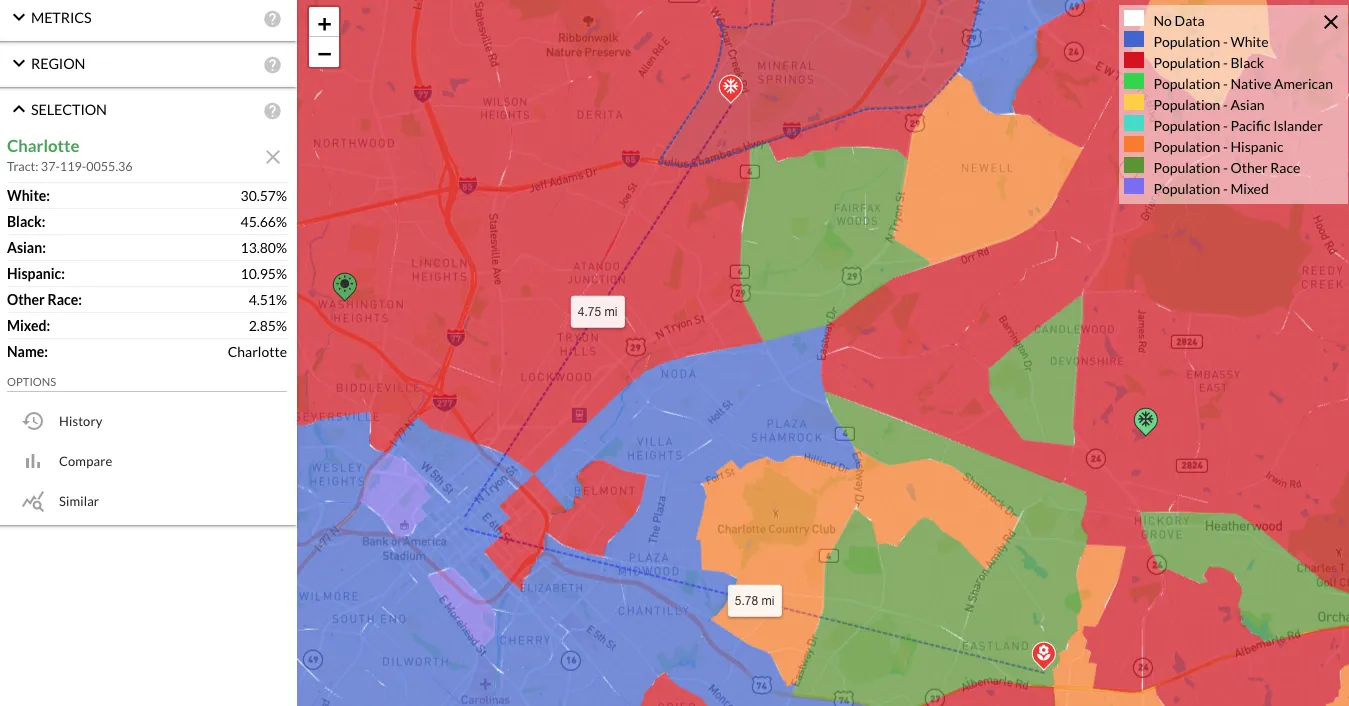 Race breakdown: 30% white, 45% Black, 14% Asian, 10% Hispanic. The 14% Asian share is unusually high for Charlotte and worth understanding.
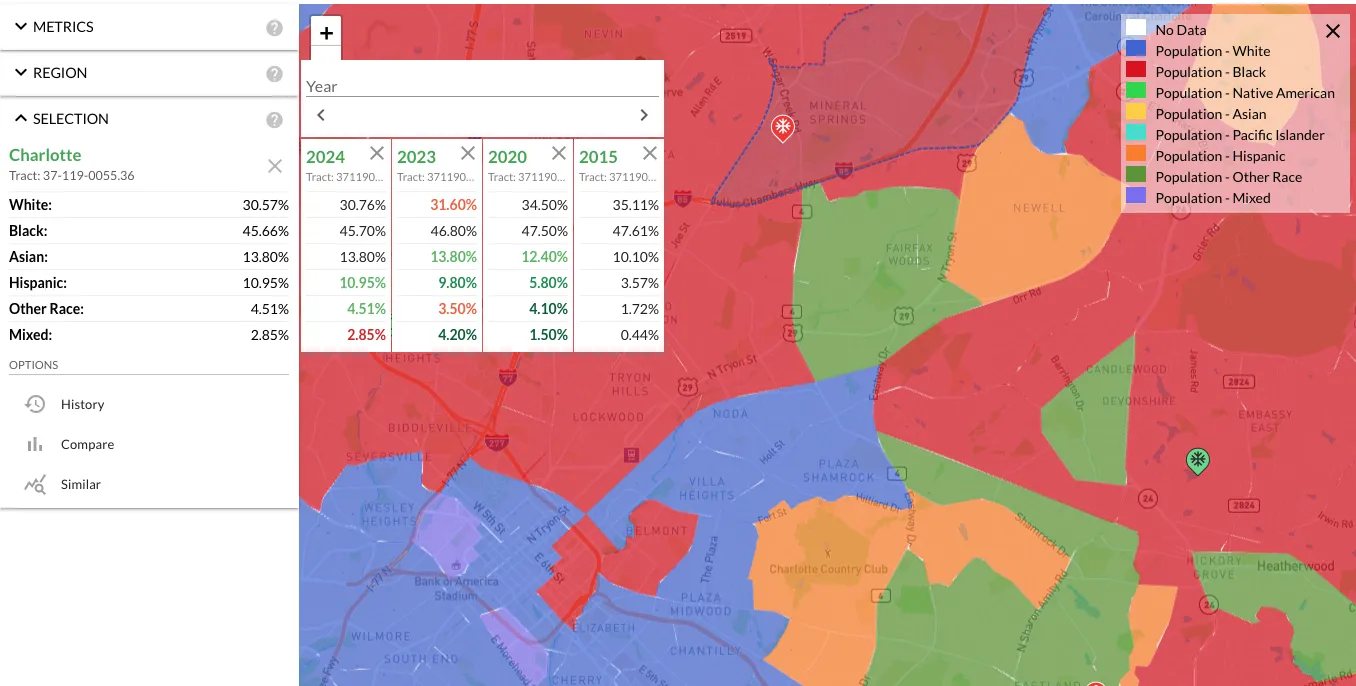 Population trend is stable. There's no significant turnover signature like there was in Property A's tract. People who live here have largely been here since 2015, which is the opposite of Property A's gentrification-corridor story. Different play. Property A is appreciation-driven; Property B is stability-driven. Both can work for short-term rental, but they're working for different reasons.
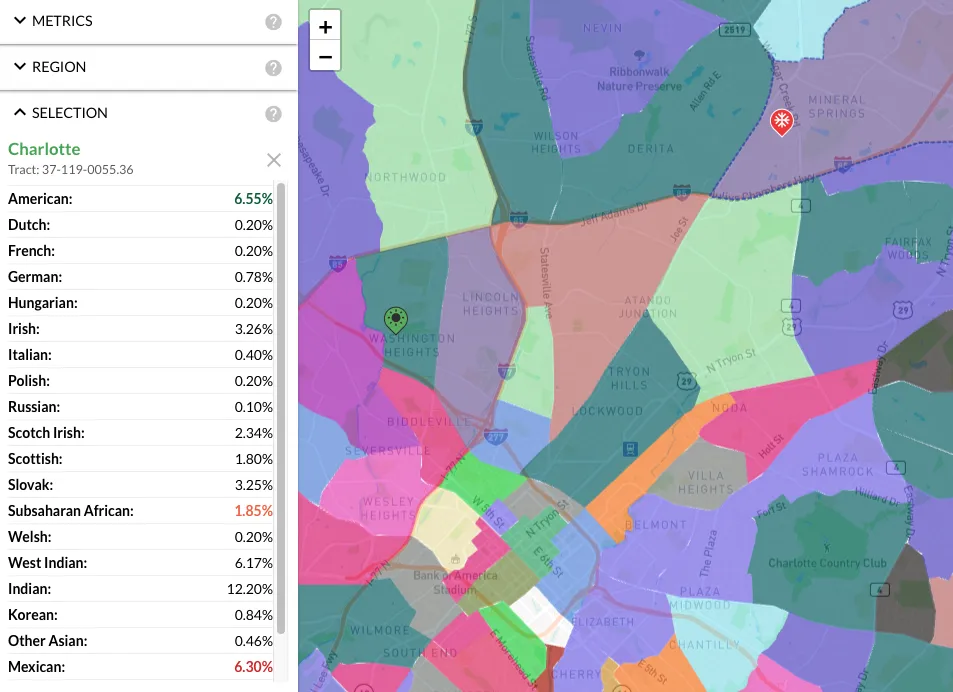 Drilling into ethnicity, the 14% Asian segment is largely Indian. The race overlay alone can't show that. Race shows the demographic transition; ethnicity shows what the neighborhood feels like to a guest checking in.
Businesses
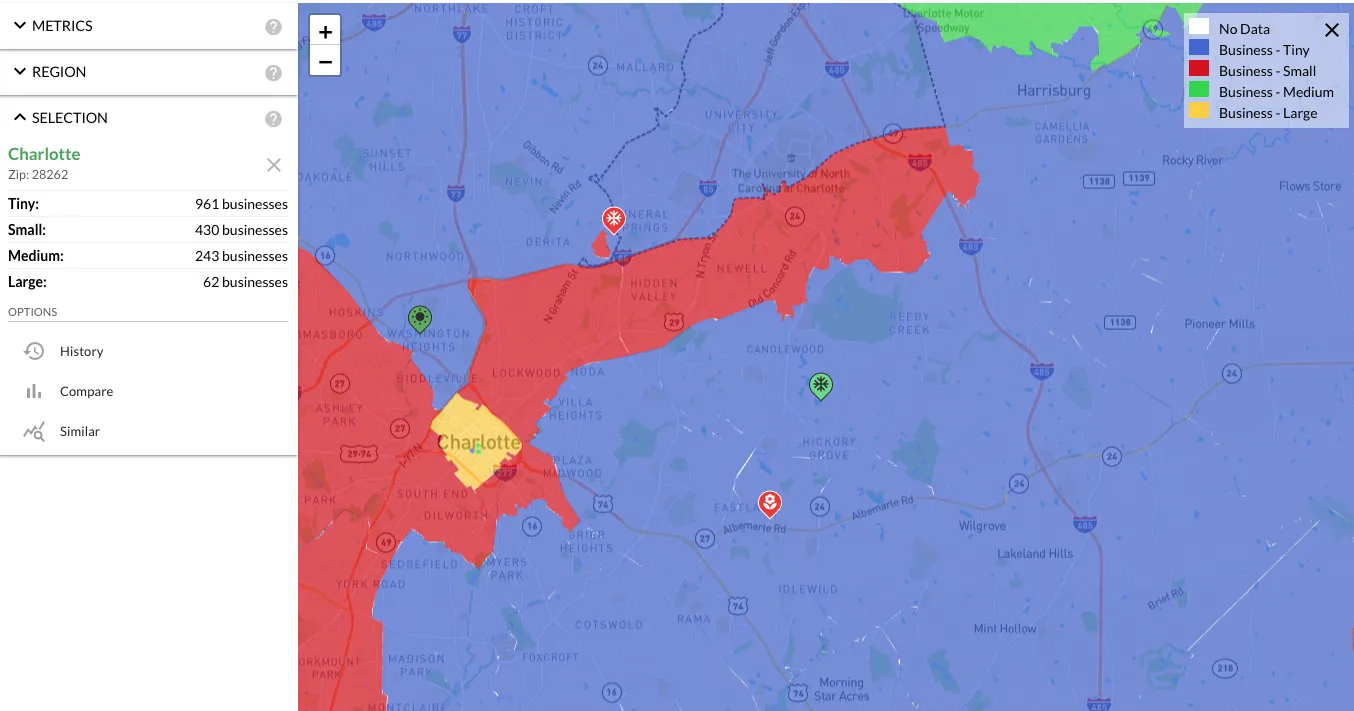 No tract-level business data is available for tract 0055.36, so we fall back to the zipcode for the business analysis. At zipcode level it's predominantly tiny businesses (961), then small (431), medium (243), and 62 large employers. That distribution is healthier than what we saw at Property A's tract. More medium-and-large employers means more wage-earners commuting in and out of the area. In this part of Charlotte, UNC Charlotte and a Bank of America insurance/finance cluster anchor the zipcode, which translates to a steady professional inflow.
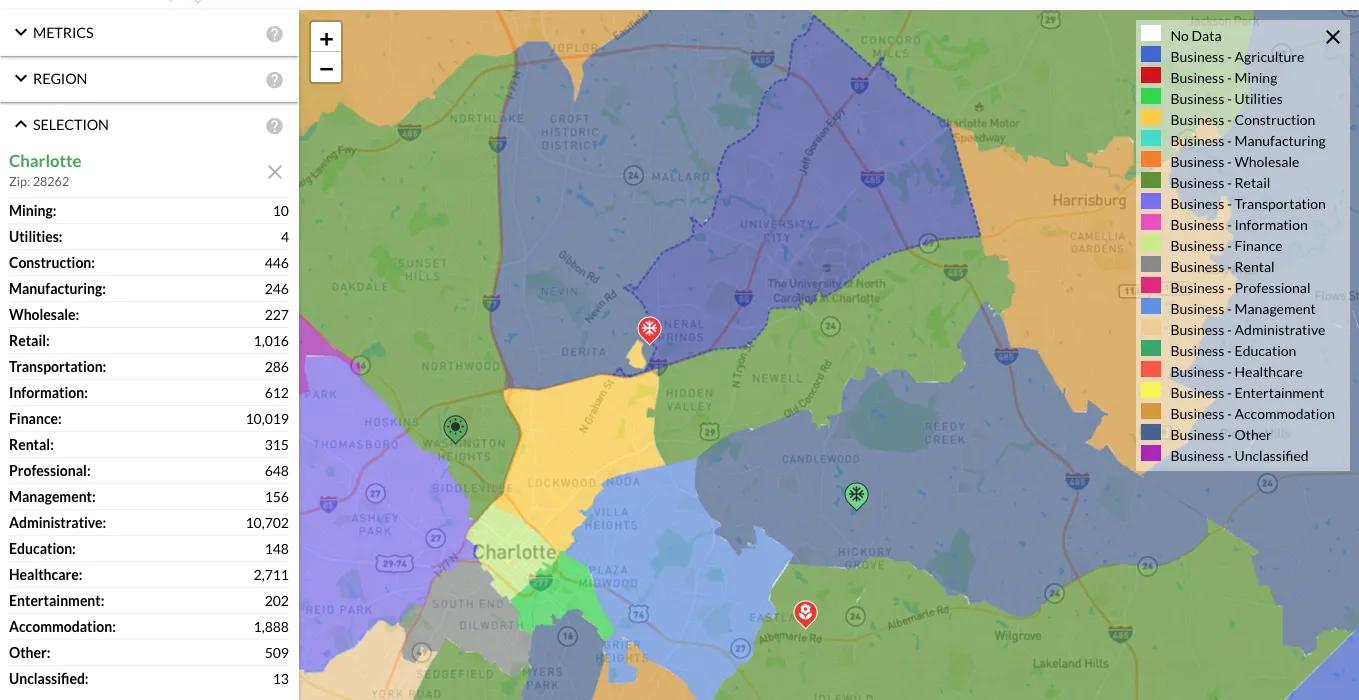 Business-score view (approximate employee count by industry) shows finance and admin both around 10k, healthcare around 2.7k, accommodation around 1.8k, retail around 1k. The accommodation cluster matters for short-term rental viability. The 1.8k accommodation employment isn't huge but it confirms there's already an STR economy here that hotels and AirBnBs are competing for share of.
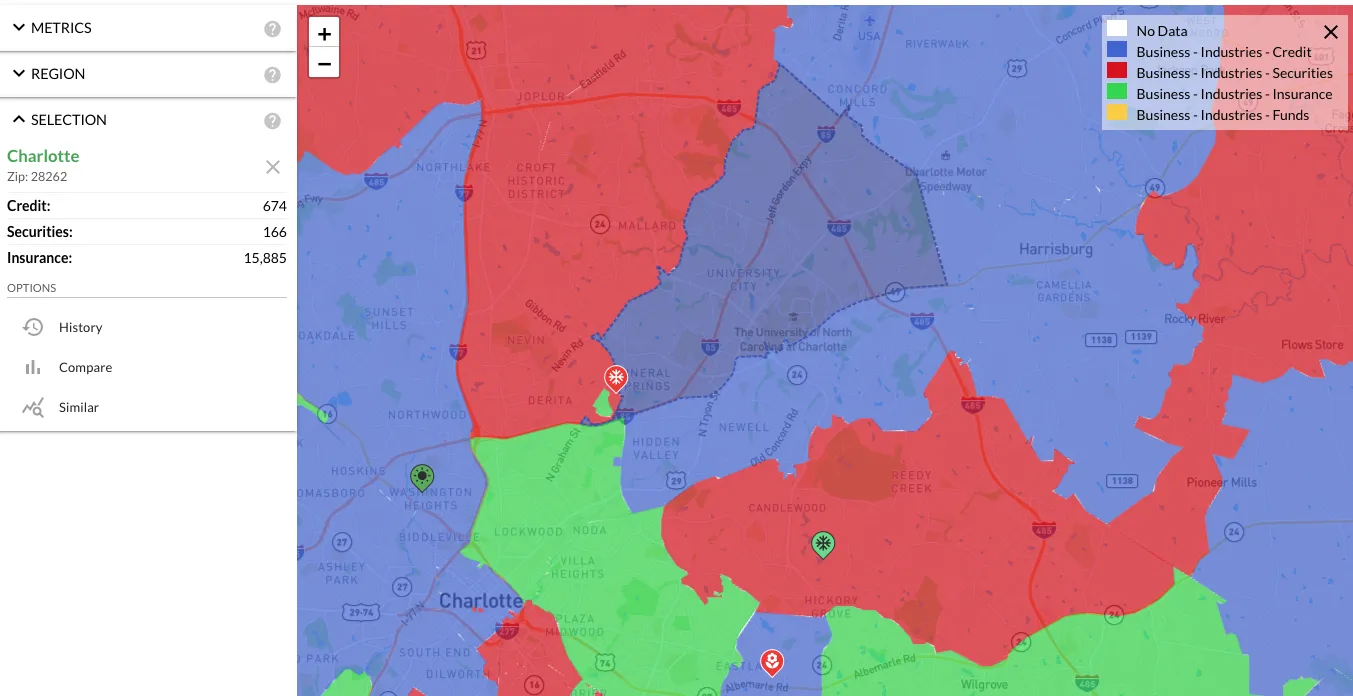 Drilling into finance (the largest single sector) shows it's mostly insurance, which lines up with the Bank of America presence in this zipcode. Insurance jobs are middle-class wage anchors. They don't drive the weekend tourism that lifts AirBnB nightly rates, but they support the weeknight business-travel demand that smooths occupancy across the calendar.
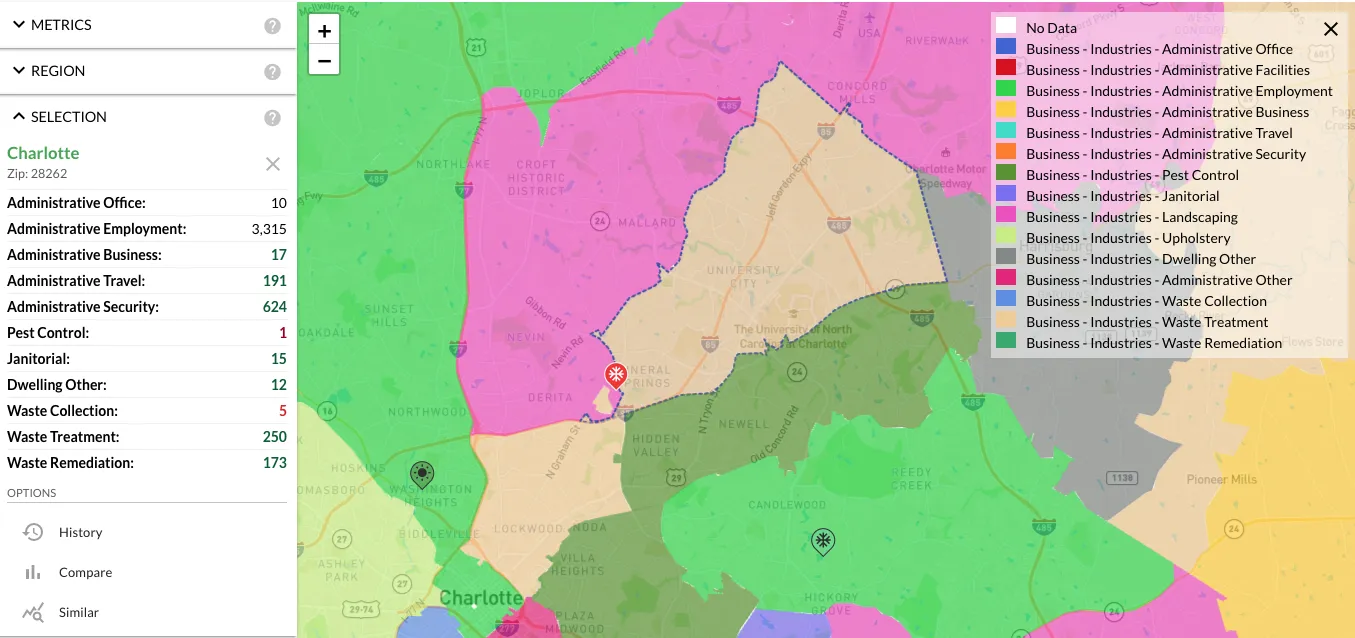 The admin breakdown is harder to reconcile. The category shows 10k at the zipcode roll-up but only 3.3k when you drill in. I suspect the higher number is either a model overprediction or a category that's pulling in some adjacent-but-not-strictly-admin employment. There's a 7k gap I can't fully explain, and I'd rather call that out than smooth it over. Either way, admin and finance together anchor a meaningful chunk of zipcode employment, and the exact magnitude doesn't change the ranking.
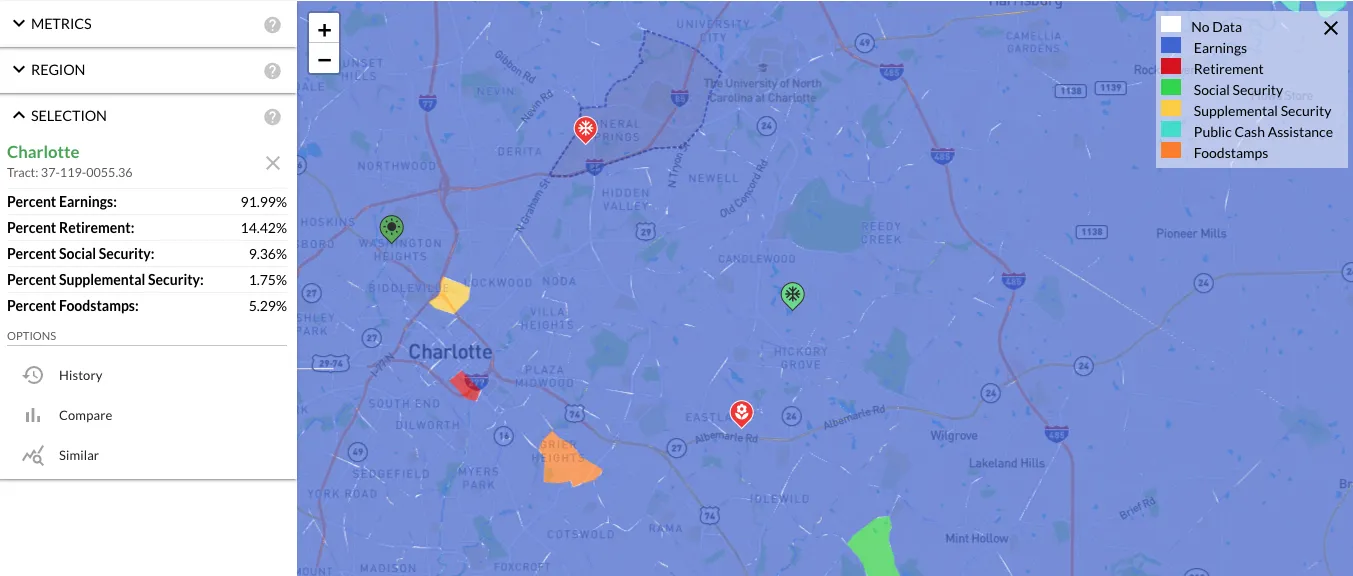 Income source distribution back at tract level: 92% earnings, 14% retirement income, 9% SSI. Earnings-dominated. The retirement-income share is consistent with the slightly older age skew we saw earlier.
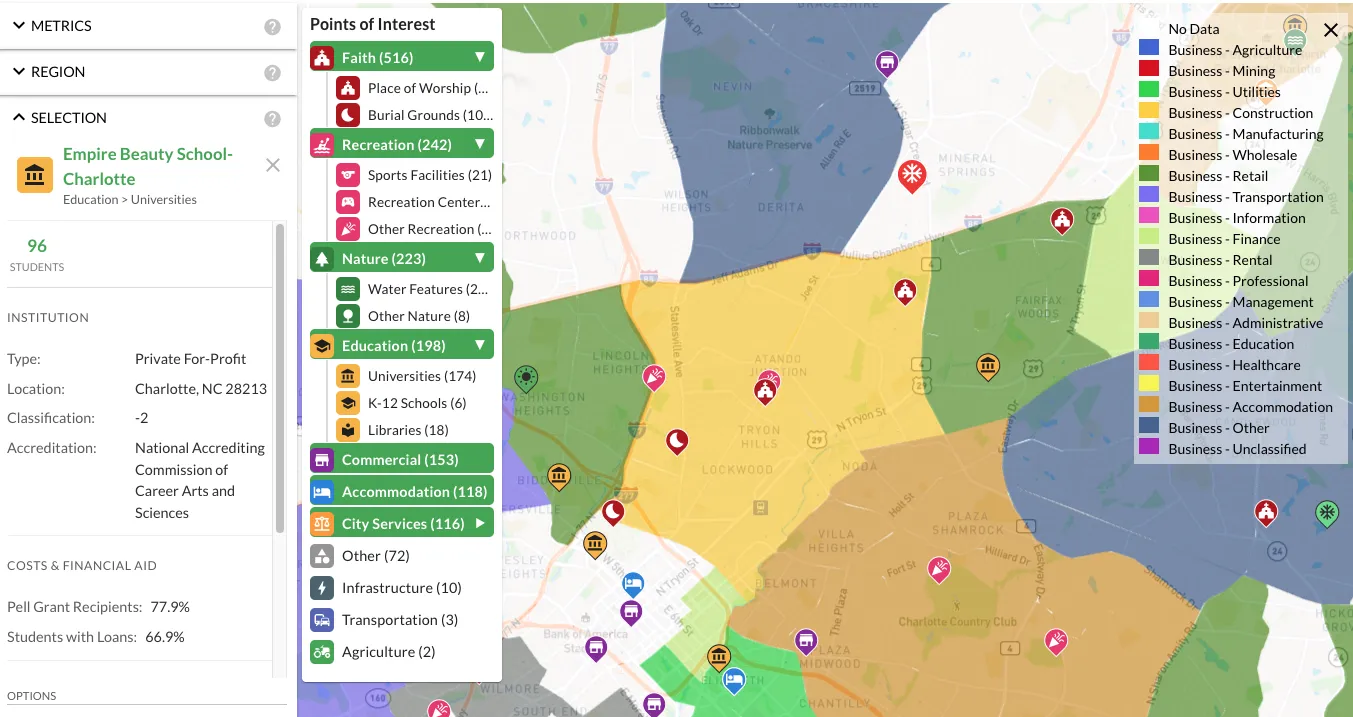 Points of interest: nothing destination-tier, but the area has the everyday infrastructure (groceries, dining, services) that makes a short-term rental easy for guests to live out of for a long weekend. As with Property A, POIs aren't carrying this case. The employment cluster is.
Side by side: how the comparison sorted out
The two properties are different products. Property A is a value-add appreciation play in a tract that's being rebuilt; Property B is a yield-stability play in an established tract anchored by professional employment. Both can support the AirDNA-comped $450-500/night, but the risk profile is meaningfully different.
| Property A | Property B | |
|---|---|---|
| Distance to downtown | 5.78 mi | 4.75 mi |
| Tract median home price | $420k | $501k |
| Tract median income | $51k | $72k |
| Population trend | Rapid turnover, demographic shift | Stable since 2015 |
| Adjacent character | Two AirBnB hotspots, gentrification corridor | UNC Charlotte / BoA insurance employment cluster |
| Primary thesis | Appreciation + AirBnB demand | Stable AirBnB demand + business-travel smoothing |
| Operational risk | Higher (teenagers, gentrification turbulence, sound-meter discipline matters) | Lower (older skew, stable population, professional neighborhood) |
| Macro tailwind | Silver Line east extension funded Nov 2025 | Existing transit + employment density |
For this client, the answer ended up being Property A. Coming out of the side-by-side, B was the safer pick on paper and that's where I'd leaned. What flipped it was the renovation plan our designer was already sketching for A: once the client saw the full buildout (palette, mural concepts, game-room conversion, backyard layout) the appreciation tail stopped feeling like risk and started feeling like the actual product. A's operational complexity is real, but that's the part our in-network property manager handles. With that absorbed, B's stability premium wasn't worth giving up A's upside. Different client might have stuck with B; this one wanted the bigger swing and was happy paying the 15% to get it.
The AirDNA numbers on Property A and Property B are within a few hundred dollars a month of each other. At 50% occupancy, we anticipate a conservative $7k/mo gross revenue, with about $2-3k net revenue after mortgage and fees. What separates them is whether the buyer is willing to pay for the management layer that absorbs Property A's operational complexity. If you are, you get A's appreciation tail without the operational headache that pulled us toward B in the first place. The right pick comes from risk tolerance and management bandwidth, not gross income.
What we do for clients, end to end
The walkthrough above is the third step in our standard concierge process. The full sequence:
- Intake and area selection. This is what Part 1 opened with: the working session on goals, risk tolerance, time horizon, and capital, ending in an area recommendation that defaults to markets we invest in ourselves. For this client it was Charlotte. Another profile might point to Austin or Cleveland; a coastal stabilization play might land on Tampa or Raleigh.
- Property visit. Part 1 mentioned this too: clients usually fly out before the property lists, often through developer relationships we maintain. This client opted for a video tour because she'd worked with us before.
- Live underwriting session. AirDNA establishes nightly-rate comps, market demand, and occupancy. Investomation covers the area trends, demographic context, business profile, and macro layer (everything you saw in Part 1 and the first half of this post). We do this on a screen-share so the client can defend the thesis themselves, not take it on faith.
- Loan. You can pick your own lender or use ours. We're currently doing 6.35% DSCR loans based on property income alone. No W2 income needed. Many of our investors prefer DSCR specifically because it doesn't co-mingle their personal-side underwriting with the rental property's underwriting. Our lenders close in under 30 days.
- Design. Optional. Our designer specializes in short-term rentals at the luxury end. AirBnB rewards unique, well-photographed properties, and the difference between a generic finish and a designed finish can be $100/night sustained over the life of the property. You can do this step yourself if you have the eye for it; most people don't, and the market is far more competitive than it was in 2021.
- Management. Also optional. 15% of gross, which is industry-standard for full-service luxury STR management. What you're paying for is the difference between 5-star reviews and 3.5-star reviews. Repeat-business compounding from 5-star reviews dominates the 15% fee over a multi-year hold. Self-manage and end up at 4 stars, and the market punishes you twice: nightly rates compress, then occupancy slips. We've watched it happen.
You can do every step of this yourself if you want to. The real price is the time you'd spend learning each step, especially the underwriting and the design parts. Whether that time is worth more than the money you'd save is your own decision. Even if you self-manage everything else, an Investomation membership is the one piece worth keeping. It's free to explore, and the live underwriting walkthrough is what clients hire us for. The rest of this case study covers the follow-through. Part 3 walks through the renovation and AirBnB design choices; Part 4 reports back six months after launch with what the numbers did. Future case studies will cover different markets, different theses, different client profiles.
