Concierge Case Study #1: Reading the Charlotte Market (Part 1)
Series: Concierge Case Study #1 (Charlotte STR)
- Part 1: Reading the Market (you are here)
- Part 2: Comparing Locations
- Part 3: Renovating for AirBnB
- Part 4: Six Months In (coming soon)
 In Is Real Estate Going to Reset in 2026? I argued the cooler 2025 market was an opening, not a warning, and mentioned I was closing on a new-construction short-term rental in one of the softer Sun Belt markets. A reader who wanted to do something similar asked if I'd walk her through how I pick the area before pulling the trigger. This post is the first half of that walkthrough. I'll show what the data looks like at the screen-share level, what I tell a client when they push back on the thesis, and where Investomation's panels do the heavy lifting. The second property she had us look at gets a separate post, because the comparison is the whole point and stuffing both into one piece would do neither justice.
For privacy reasons I'm not naming the client or the exact street addresses. I'll refer to the two candidates as Property A and Property B. The tract IDs are public-record geography and they're visible in the screenshots, so I've left them in. Numbers, rates, conversation excerpts, and the conclusions are real.
How a private research session runs
Before any panels open, we run a short intake. I want to understand the client's risk tolerance, time horizon, capital available, and whether they're trying to compound aggressively or park money somewhere that beats inflation, this is part of our Concierge service. From that conversation I recommend an area, and 90% of the time it's somewhere I already invest. We don't sell areas we wouldn't put our own money into, this also makes it easier to recommend a property manager I already work with. For this client I recommended Charlotte. I have a few short-term rentals in nearby zipcodes, my acquisition team is already on the ground, and a luxury-AirBnB designer we work with has finished out two of the homes I own there.
We typically invite the client to fly out and walk the property with us, often before it lists. Most people prefer to physically see the area before wiring $500k+. This client had worked with us on a previous deal, so we did a video tour instead. AirDNA established the comp baseline ($450-$500/night, ~60% occupancy, ~$7k gross monthly), debt service on a 6.35% DSCR loan came in under $3k/mo, and after the 15% management fee she was looking at roughly $3k/mo net on new construction with little maintenance drag. That's the underwriting frame. The Investomation pass that follows is about whether the area supports those numbers for the next decade, not whether the property itself prices in.
Property A: zipcode-level read
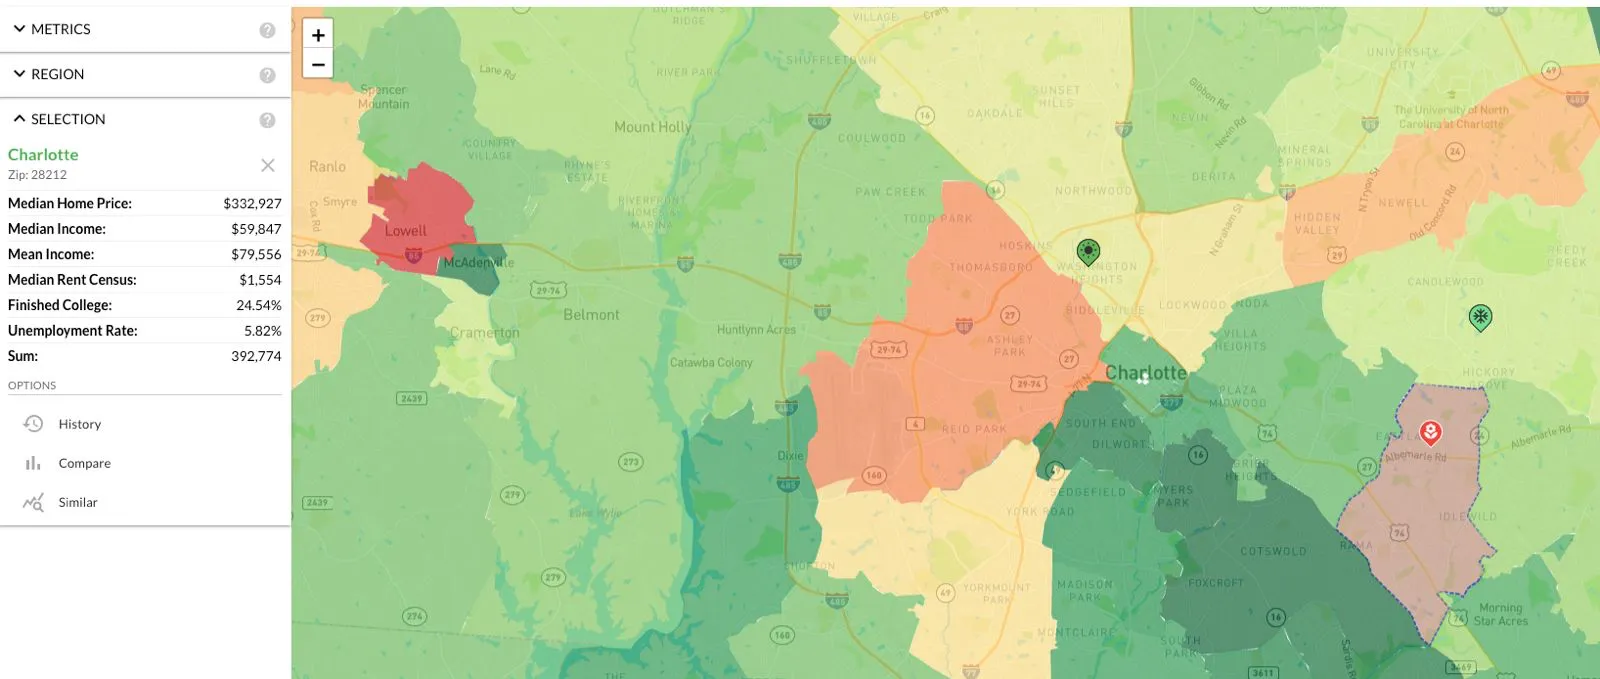
The first view is a zipcode heatmap of Charlotte. The red flower marker is Property A. The two green markers are short-term rentals I personally own in nearby zipcodes. I lead with this because credibility in this work comes from skin in the game. I trust my numbers because I already proved them with my personal portfolio.
At zipcode resolution this area reads $330k median home price, $59k median income, $79k mean. The mean-to-median spread is the first thing I notice. A wide gap usually means the zipcode contains both a stable middle class and a higher-earning segment that hasn't yet pulled the median up. That's typical of an area in transition. But zipcode is a coarse lens, and this particular zipcode wraps a chunk of east Charlotte that's bigger than downtown itself, so a single number across that footprint hides more than it reveals.
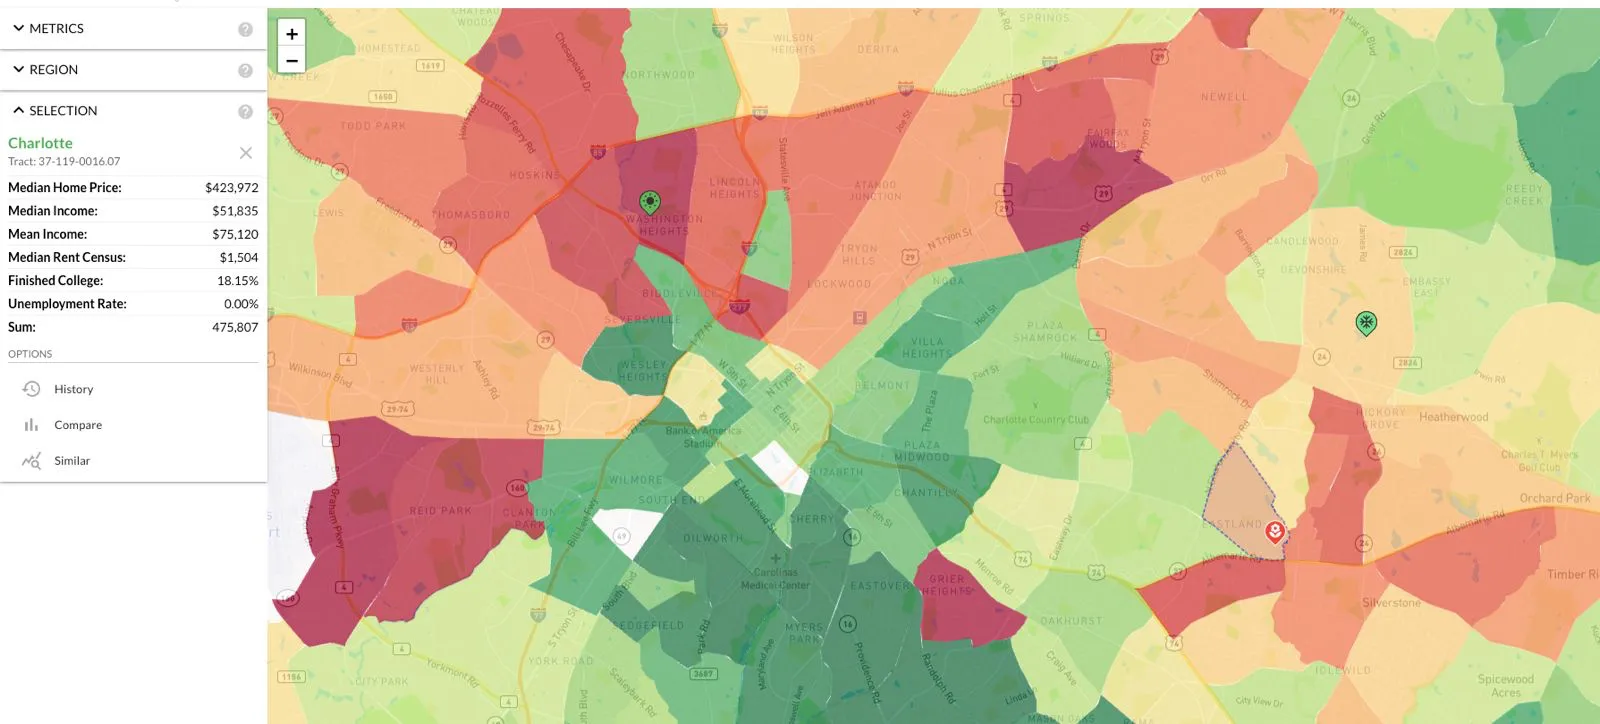 Switching to tract level (37-119-0016.07) sharpens the picture. The tract median home price is $420k, which lines up with the ARV on Property A. Tract incomes are a little lower than the zipcode average ($51k median, $75k mean), but the tract sits on the boundary between two visibly greener (higher-income) areas, both of which are established short-term rental hotspots. Gentrification doesn't usually hop tracts; it spills. Being adjacent to two areas that already work for short-term rental is a more useful signal than the absolute income number.
One number I flagged for the client: tract-level unemployment shows 0% two years running. Census reported it that way, our model extrapolated it forward, and I don't believe it. ACS samples in tracts undergoing rapid demolition and rebuild get noisy because the population in residence at the time of the survey isn't representative of the population a year later. I told her to read the 0% as "low but not zero." Calling out the data quality up front keeps clients calibrated. They learn to see the model as a tool rather than gospel, which makes the rest of the conversation more productive.
Trend analysis: prices, income, rent
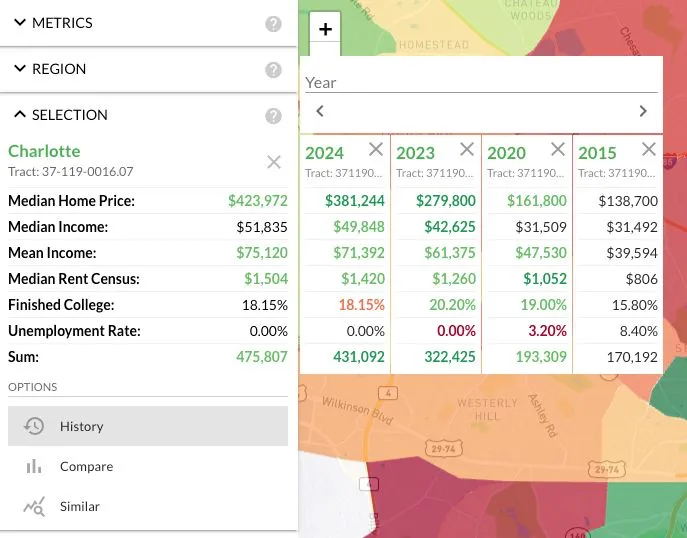 Tract home prices have roughly doubled since 2020. The Charlotte MSA grew 7% over the last 5 years, which is much higher population growth than something like Boston, but the tract appreciation is steeper than the MSA because of new-construction housing stock turning over inside the tract. This is where the client pushed back. "Any chance these prices fall? A lot of US cities are entering a buyer's market right now."
I told her the buyer's market we're seeing is temporary and uncertainty-driven, not structural. The dollar continues to lose purchasing power; inflation isn't over, it's pulsing in cycles, and that will continue for at least the rest of the decade until salaries catch up to the new price level. "Can prices reset?" she asked. They can't, not in the way she meant. Once you raise minimum wage you don't unraise it. Blue-collar service prices are already up; what hasn't repriced is the white-collar salary base, and that's the thing that has to catch up before any of this stabilizes. I walked through the mechanics in detail in Mathematics of Inflation, and it applies cleanly here.
The Charlotte-specific layer on top of that: the city is absorbing Northeast price refugees. Why pay $1M+ for a 1,500-sqft pre-war Boston home that's falling apart when you can buy 2,700 sqft of new construction in Charlotte for $500k, work remotely, and keep the same standard of living for under $100k a year? Property tax math reinforces it. Boston is shifting its tax burden onto residential owners while its commercial base shrinks, Charlotte runs surpluses and lower effective rates. Could Charlotte cycle through its own correction? Sure. But the safety margin is large because:
- Replacement cost is rising. You can't build these homes for $200/sqft anymore even if you wanted to.
- The Fed reversed course from quantitative tightening to easing in December 2025. The next inflation wave is already in the pipe.
- Charlotte is on the receiving end of net migration. It's in the path of progress.
- I'm still buying in both Charlotte and Austin, which tells you what my conviction looks like in dollars rather than words.
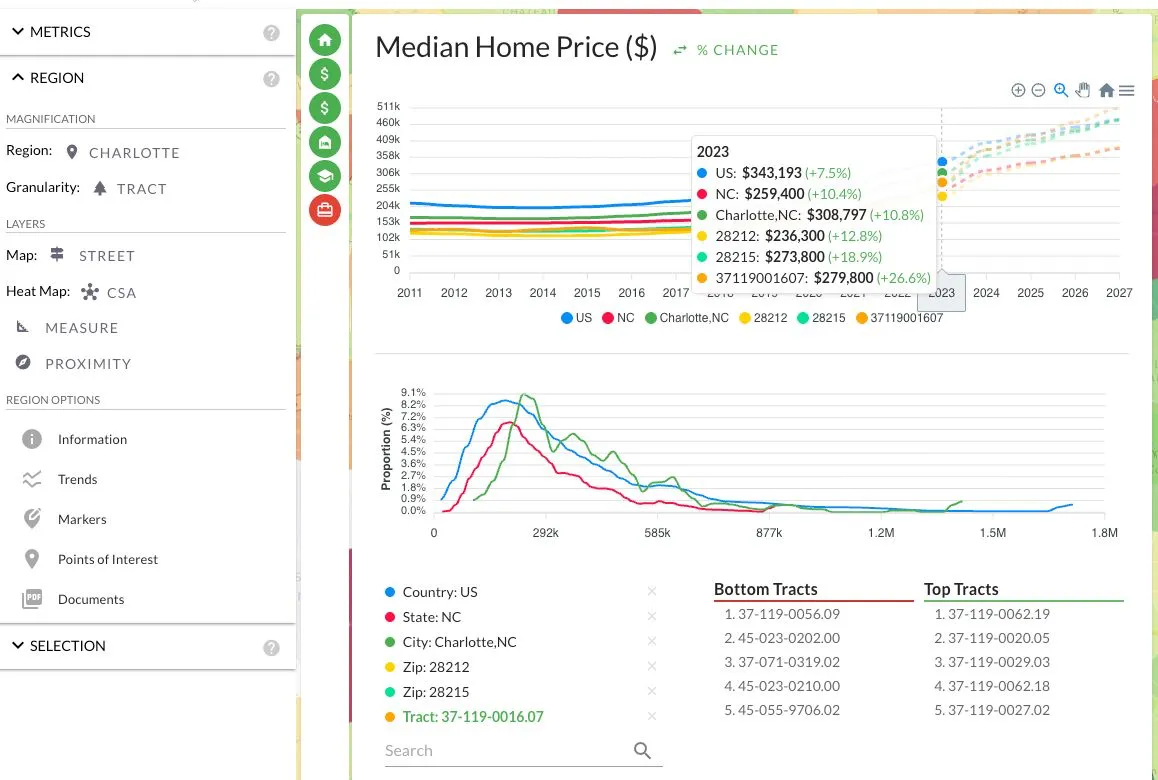 The orange trend on this chart is Property A's tract: 26% median home price appreciation in 2023 alone. Most of that is new construction changing the housing stock itself. The tract is being rebuilt into a different product, which is a separate phenomenon from price appreciation on the existing stock.
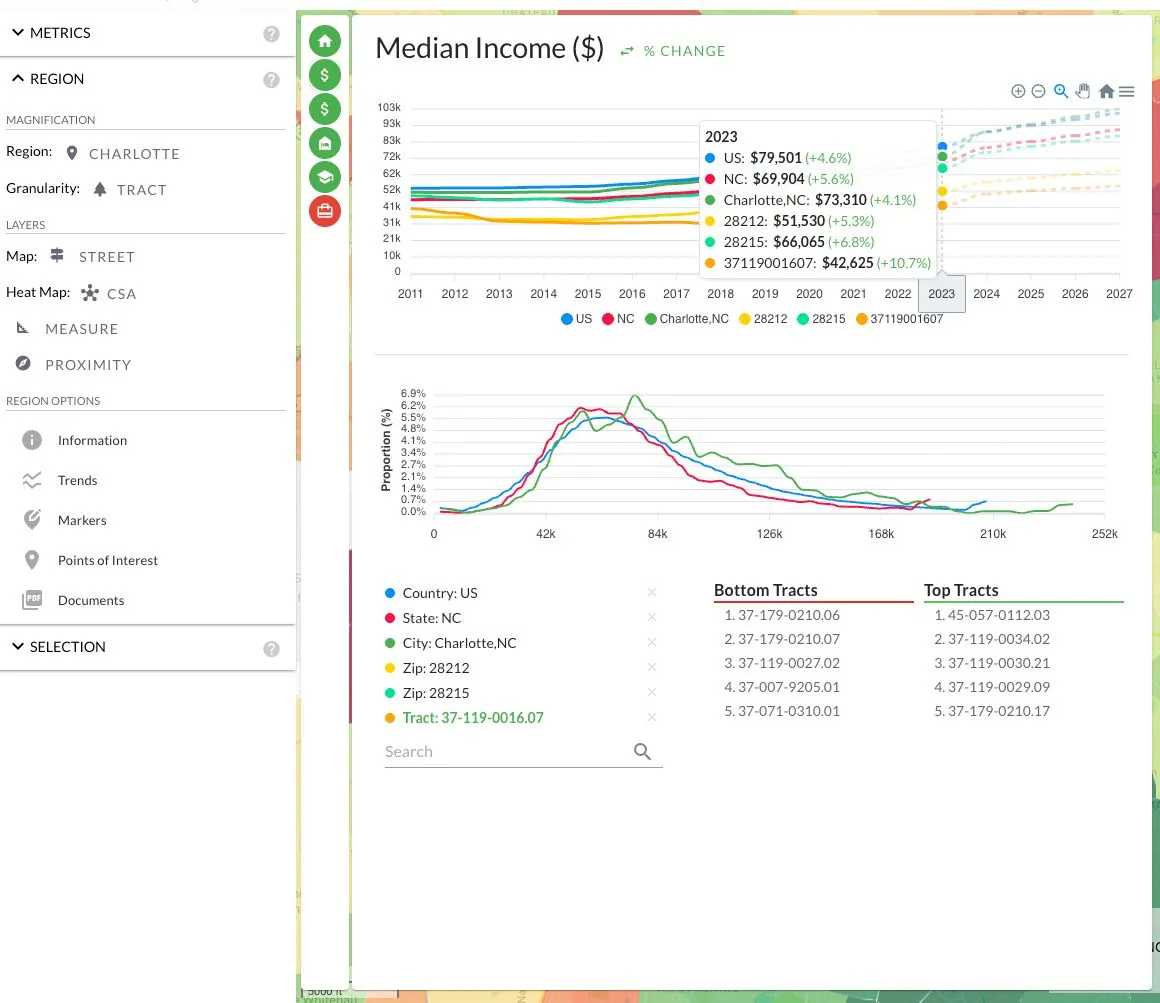 Income shows a 10.7% jump in 2023. I'm citing 2023 because that's directly from Census; the dashed segment is our extrapolation. The reason I cite the source line on each chart with the client is that it lets her separate hard data from model output, which is what an underwriter does anyway.
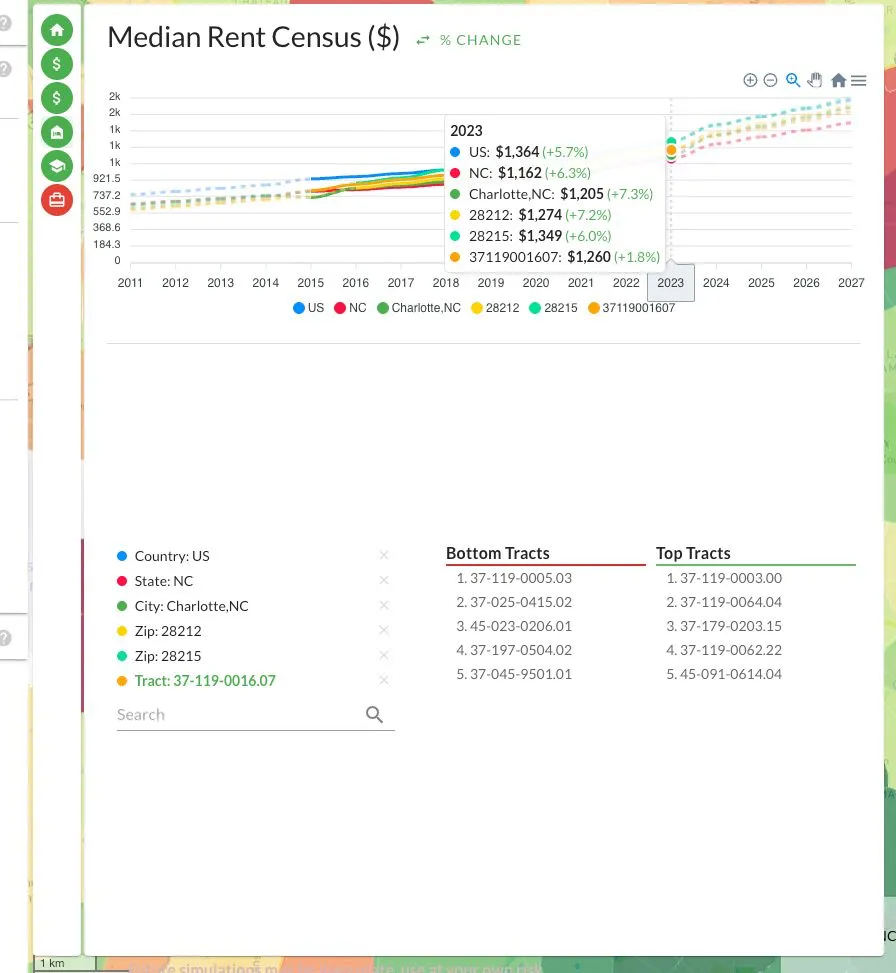 Rent growth in this tract was only 1.8% in 2023. That doesn't matter for a short-term rental thesis, but I always show it because long-term rental fundamentals act as the floor. If long-term rents collapsed while short-term rates held, that would be a flag. Here, long-term rent is mostly flat and short-term comps are strong, which means the thesis is dependent on AirBnB demand specifically, not on a generalized rental shortage.
Demographic shift: what the model can't quite see
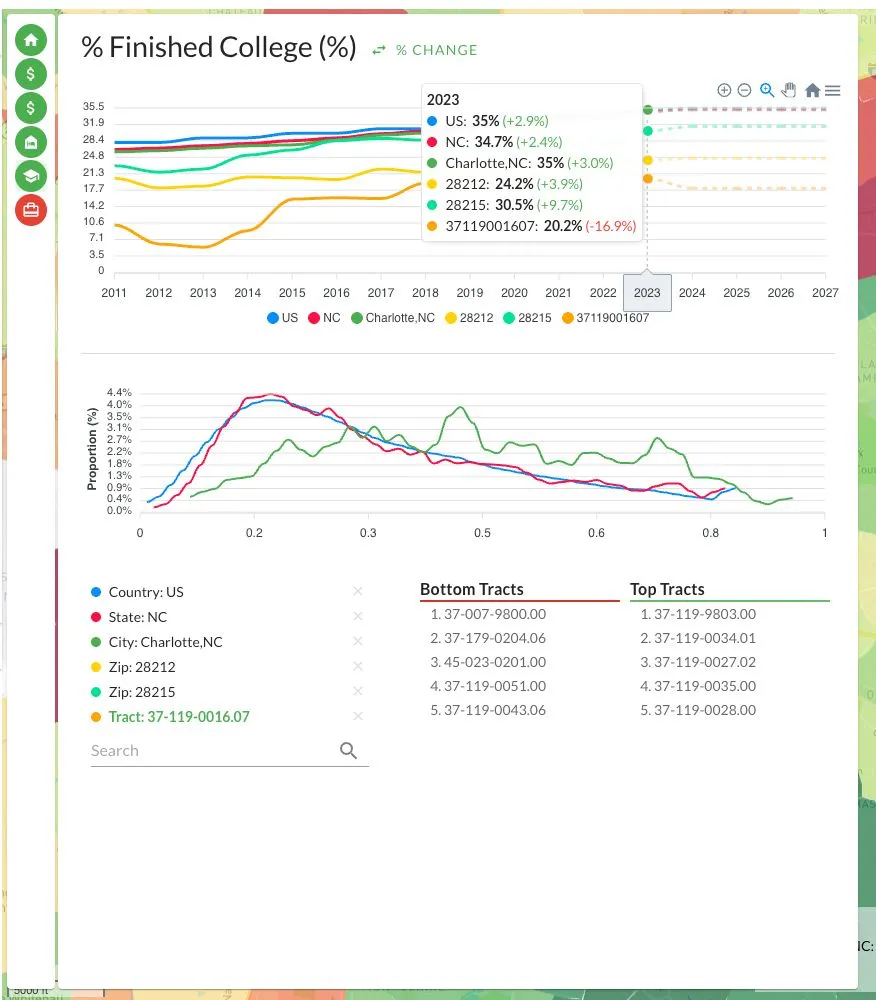 College-finished percentage dropped in 2023 while income was rising. That's an unusual combination. Either the new arrivals are higher-earning non-college tradespeople (uncommon at this income tier), or the data is capturing a transition where one population is being replaced by another faster than the rolling Census windows can resolve.
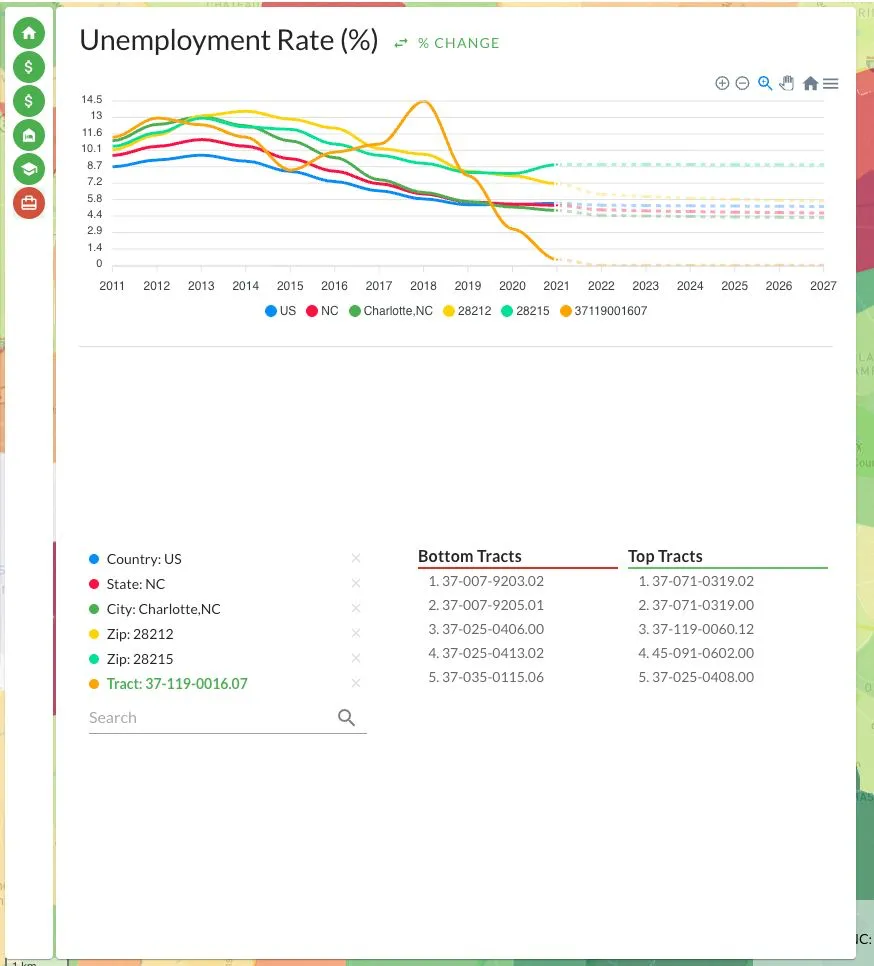 Unemployment shows the same dislocation. 2021 reads as 0%, which is what the Census fed our model, and given that 2021 was an active demolition-and-rebuild period in this tract, the survey likely missed the residents who got displaced. Treat the 2021-onward unemployment as directionally low rather than precisely measured.
This is consistent with what's documented for the broader corridor. Charlotte Urban Institute's citywide displacement-risk mapping flagged east-side tracts on the Independence Blvd corridor as high-displacement-risk, with sharp population turnover and double-digit inflation-adjusted home-price increases over the last decade. That's not the exact tract Property A sits in, but it's the same gentrification corridor and the dynamics are the same. The Silver Line east extension was funded by Mecklenburg County's November 2025 sales-tax referendum and runs the Independence Blvd corridor toward Matthews, which accelerates the next decade of pricing on the tracts it threads through.
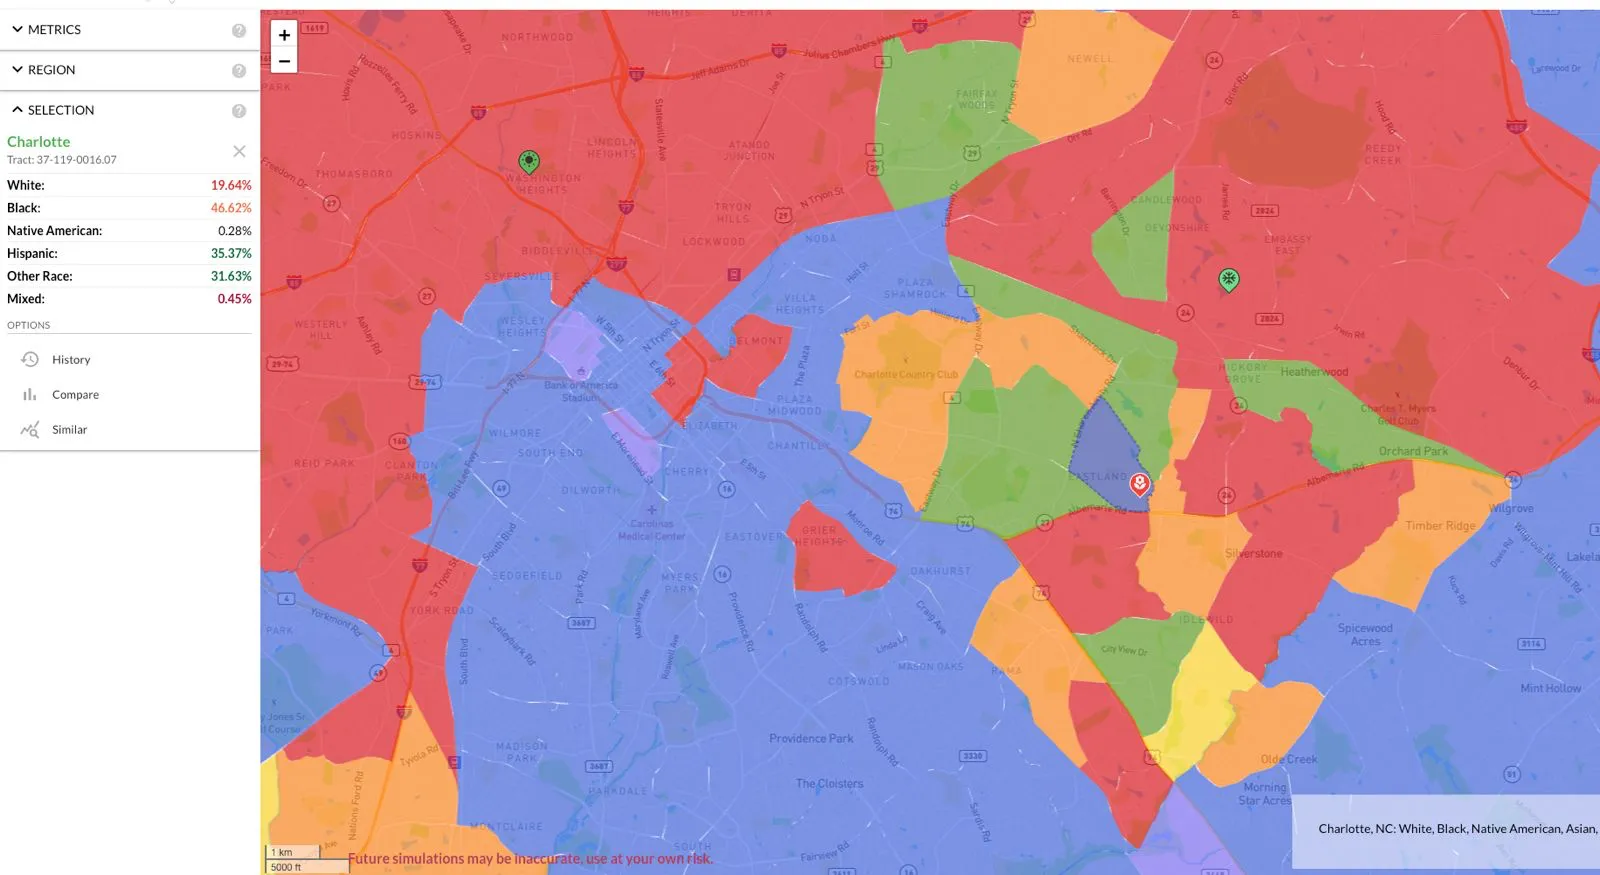 Today the area reads as Black-Hispanic on the race overlay.
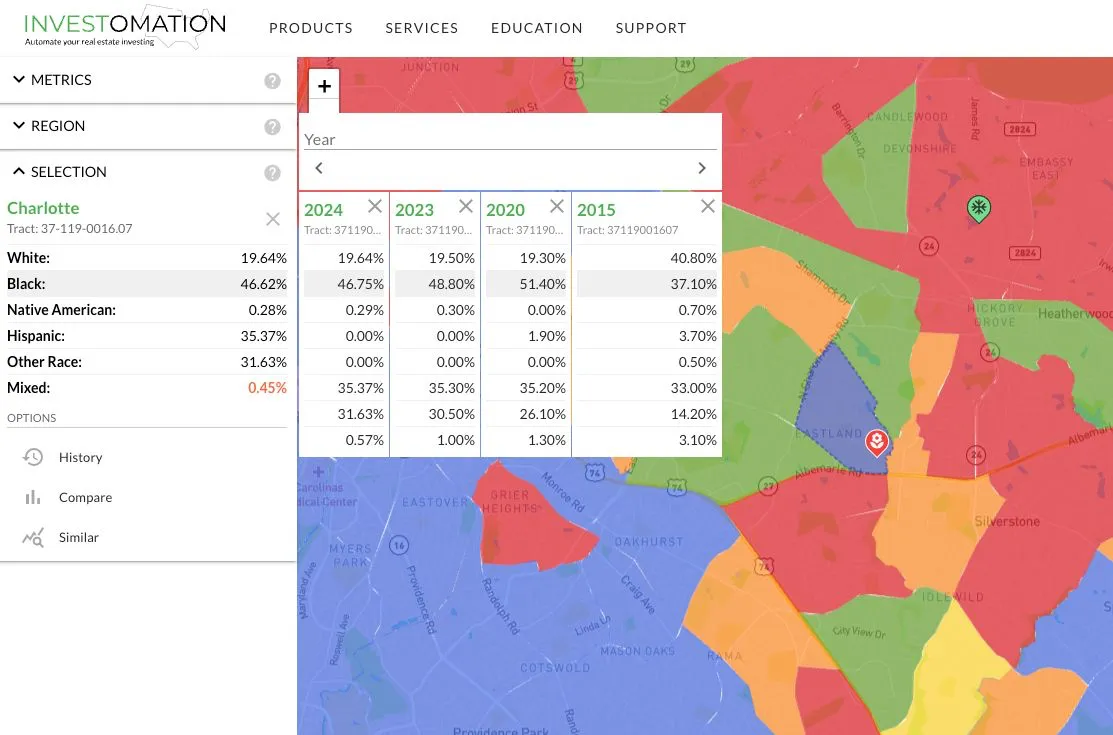 But comparing 2015 and 2020 you can see the tract used to be more white. The shift is real and ongoing. I'd like to caveat that some 2015-2020 race-proportion data has known quality issues at fine geography, so I wouldn't anchor a thesis to the exact percentages, but the direction of travel is well-documented in Charlotte planning materials.
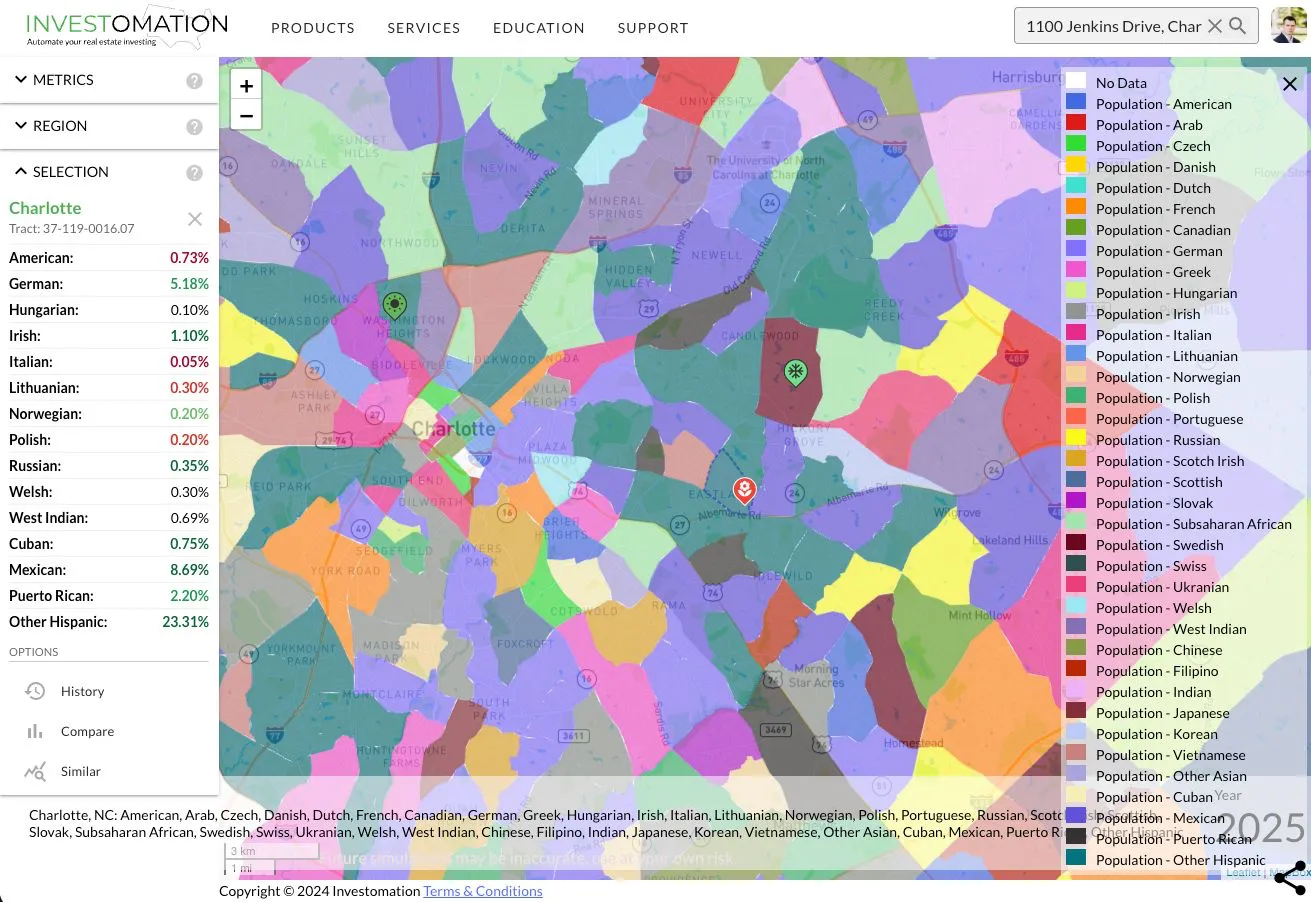 Drilling into nationality, the area is roughly 8.7% Mexican, 23% Hispanic overall, with a non-trivial German cluster. For a short-term rental that's mostly noise. Guests don't pick a property based on the host neighborhood's ethnic composition. The signal is useful for understanding the long-term character of the area, not for the immediate underwriting.
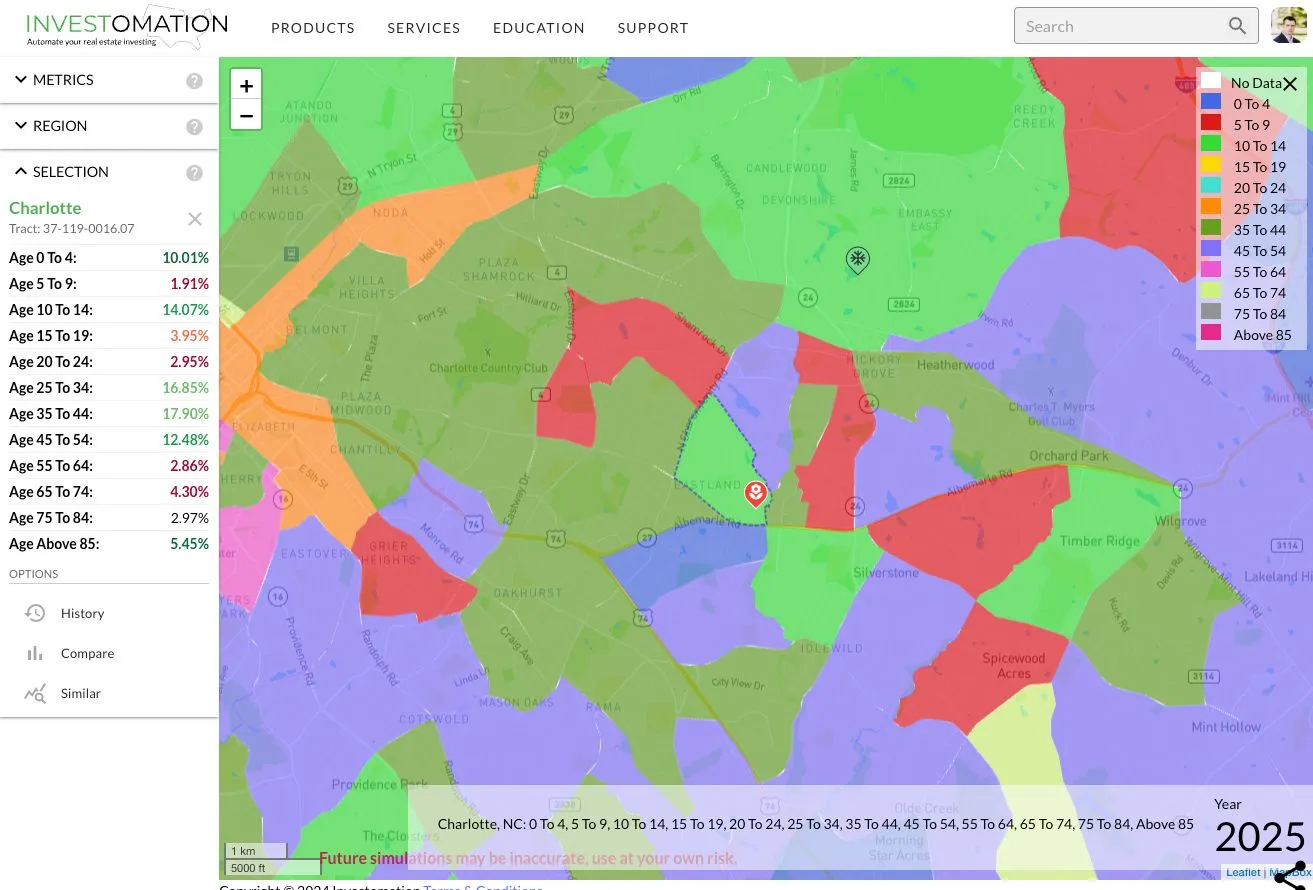 Age tells the more relevant story for a rental: 25-45 is the dominant cohort, which is family-formation age. There's also a 14% teenage presence in this tract.
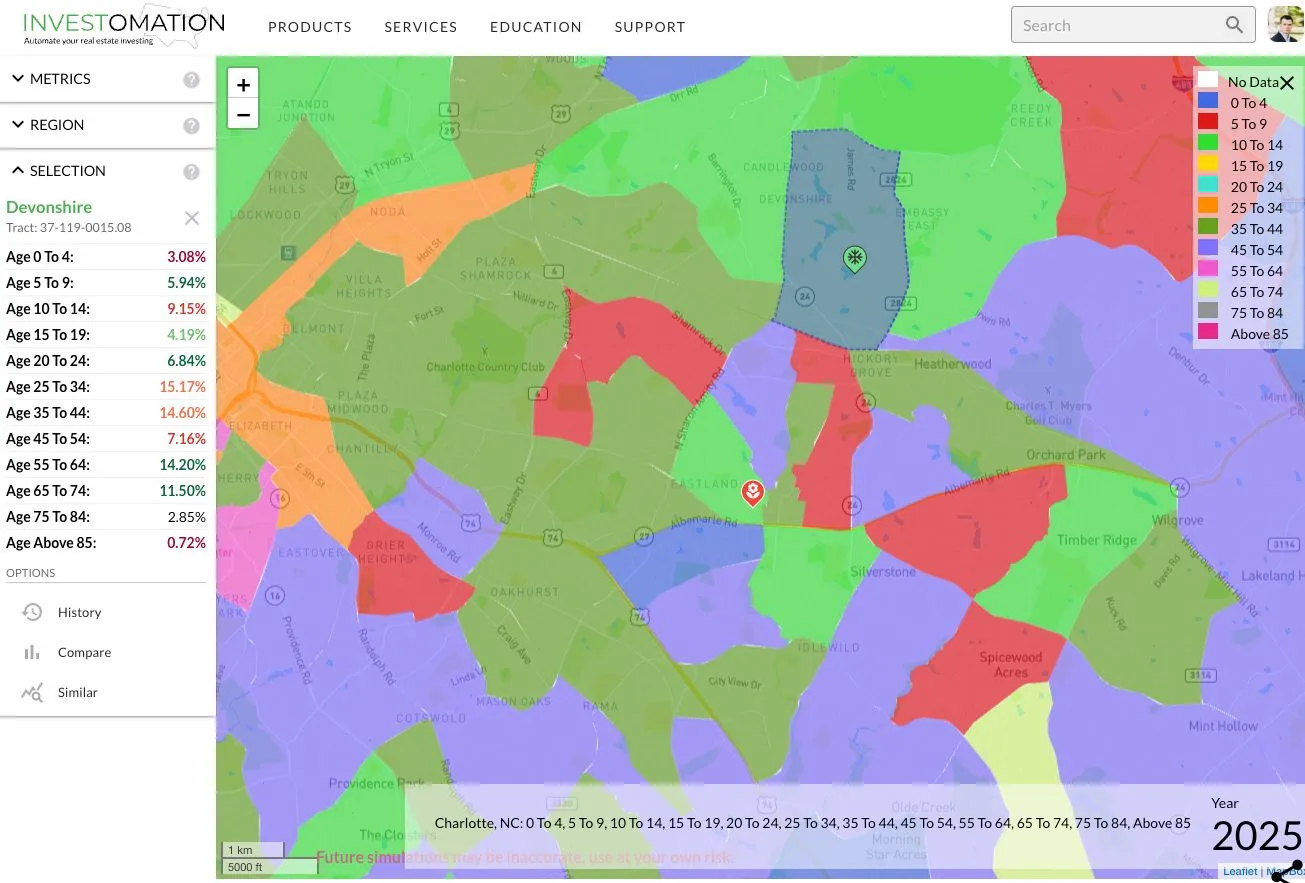 For comparison, this is one of the nearby tracts I have a property in. Skews older. That works for me because my property has enough land buffer that noise complaints aren't a meaningful risk. For Property A, the high teenage population is something to factor in. Teen presence increases the probability of vandalism complaints, late-night noise, and the kind of neighbor-driven AirBnB complaints that produce regulation. It's not uncommon for graduates to rent out a local AirBnB to celebrate, and while that in itself is not a problem, these can easily devolve to loud parties and underage drinking that neighbors tend to complain about.
We mitigate this on every property we manage by installing sound meters. They're less invasive than cameras, most guests don't object, and they give you a 30-minute heads-up before a party gets out of hand.
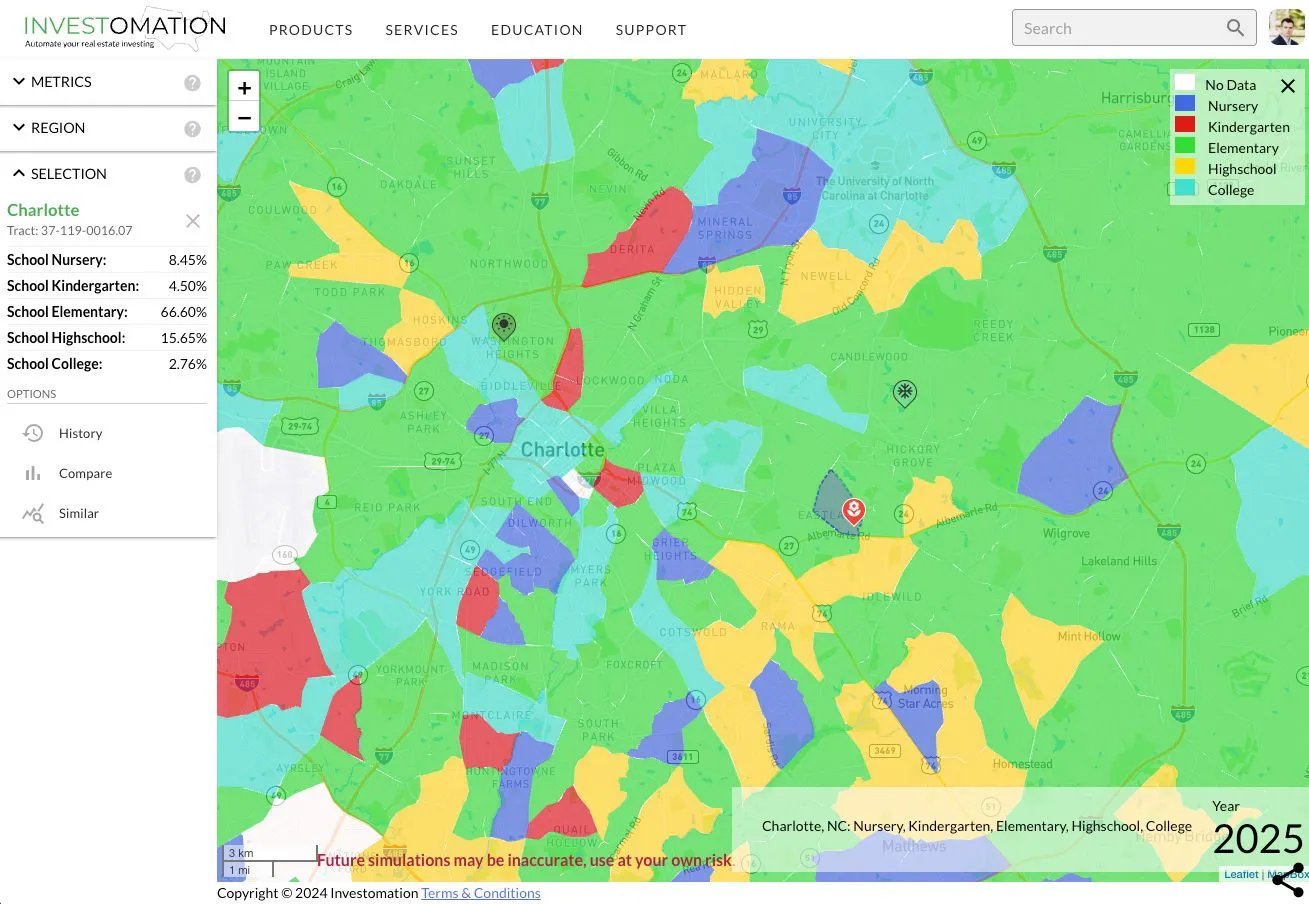 Dominant educational attainment by tract. The light blue tracts are college campuses. Property A's tract reads "high school" as dominant attainment, which is consistent with the family-formation demographic; their kids are still in school. It's also consistent with the displacement-and-rebuild thesis: the older, higher-attainment population is what's leaving.
Local Businesses
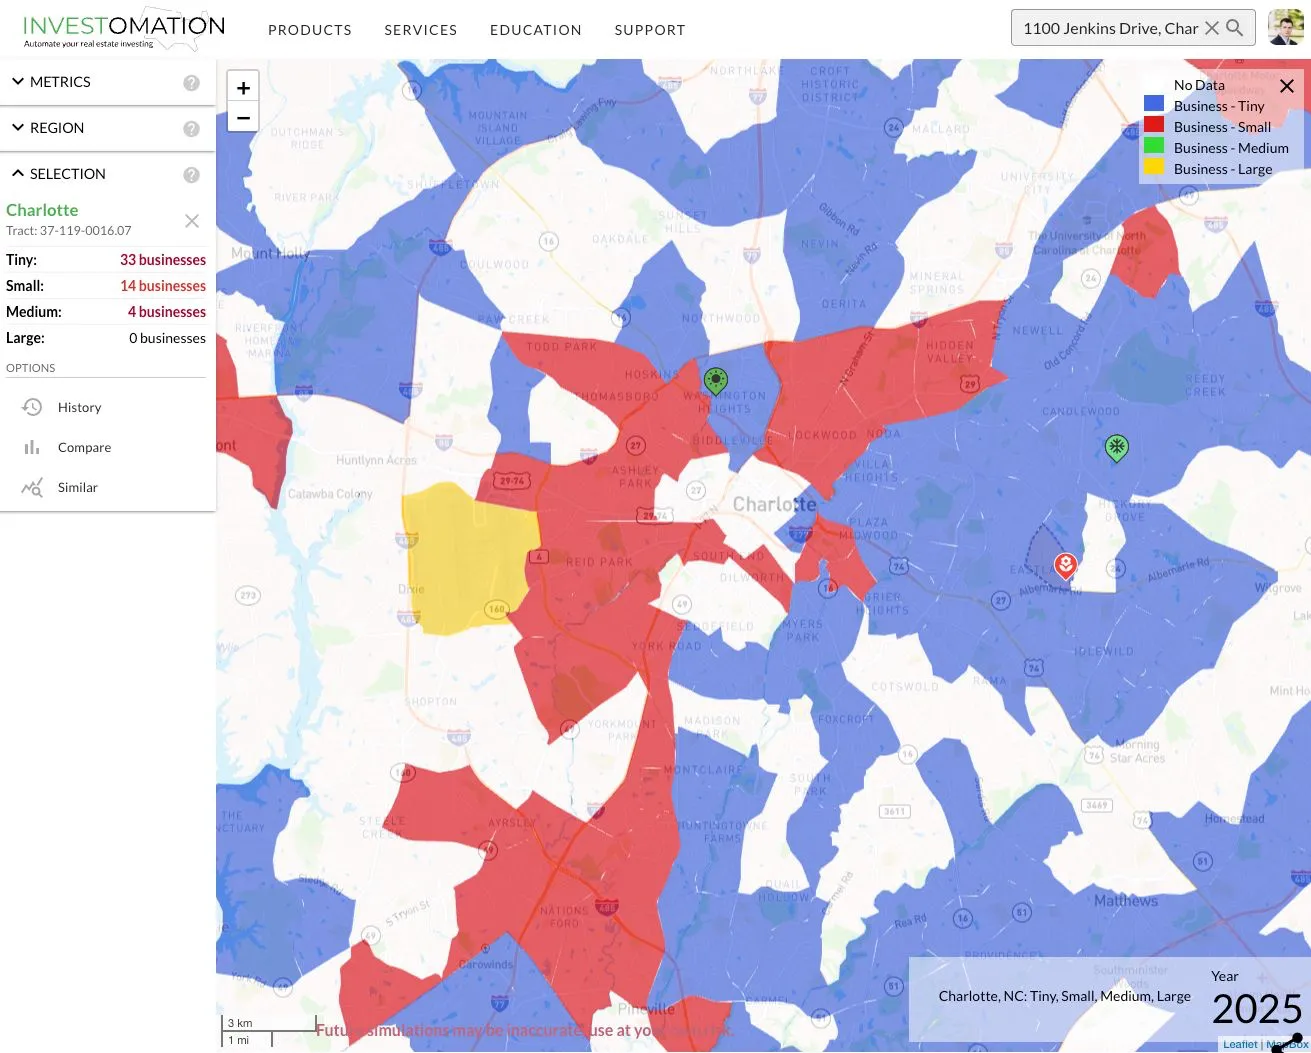 Most of the area's employment is tiny businesses (0-5 employees). Yellow markers are large employers; in this part of Charlotte the airport is the dominant one. Green is the medium tier (100+ employees). Most of the city is small business, suburbs are tiny businesses, with concentrated employment hubs interspersed.
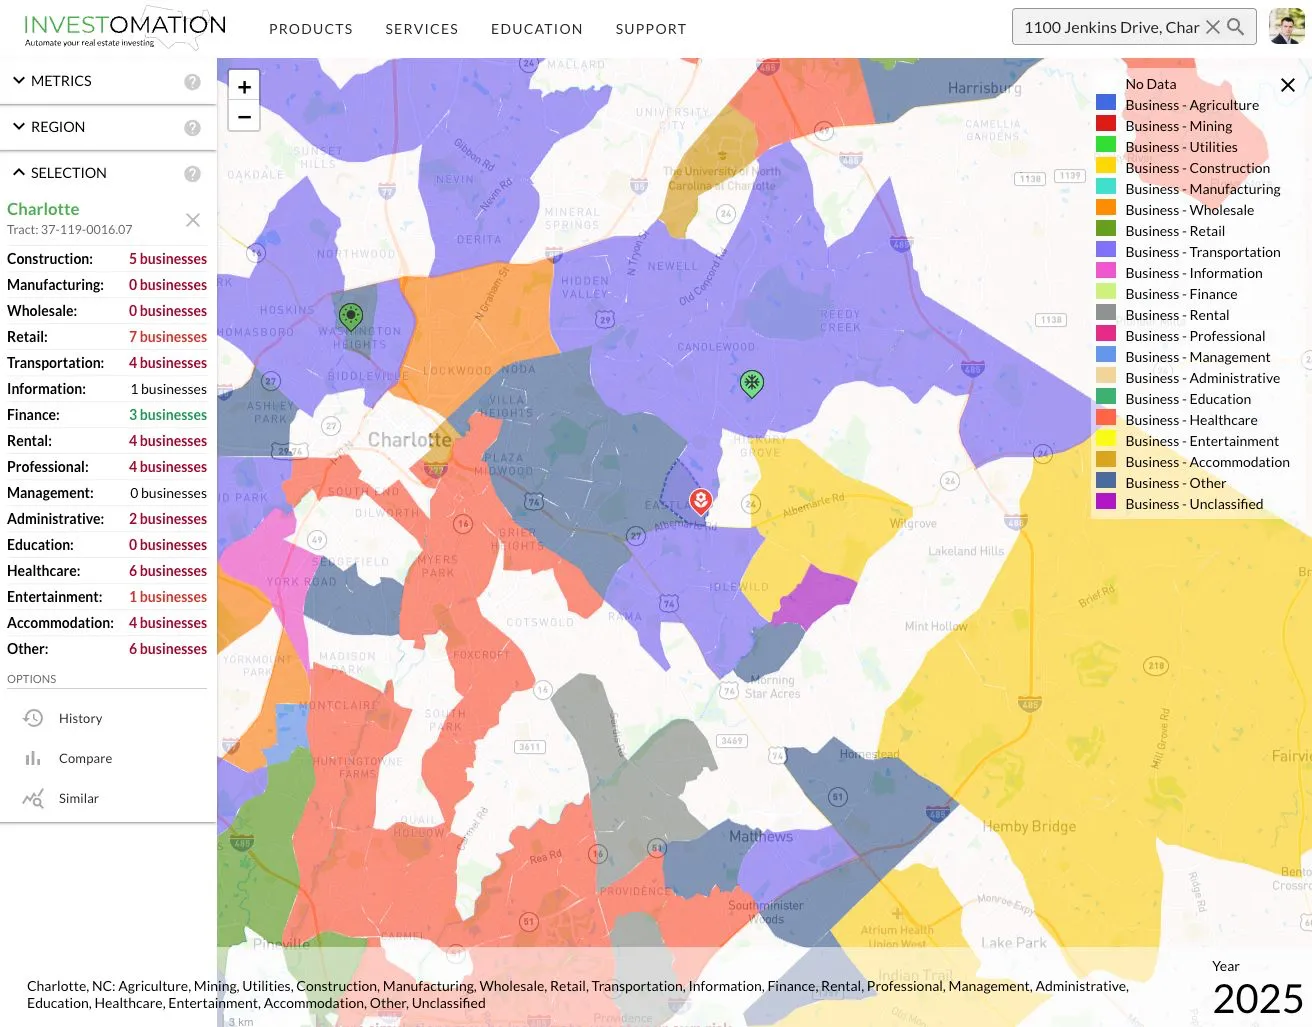 Property A's tract is close to a rental hotspot (grey overlay) and an accommodation hotspot. The rental hotspot has tight enough margins that conversion to long-term rental wouldn't pencil; the accommodation hotspot is what makes this property work as a short-term rental.
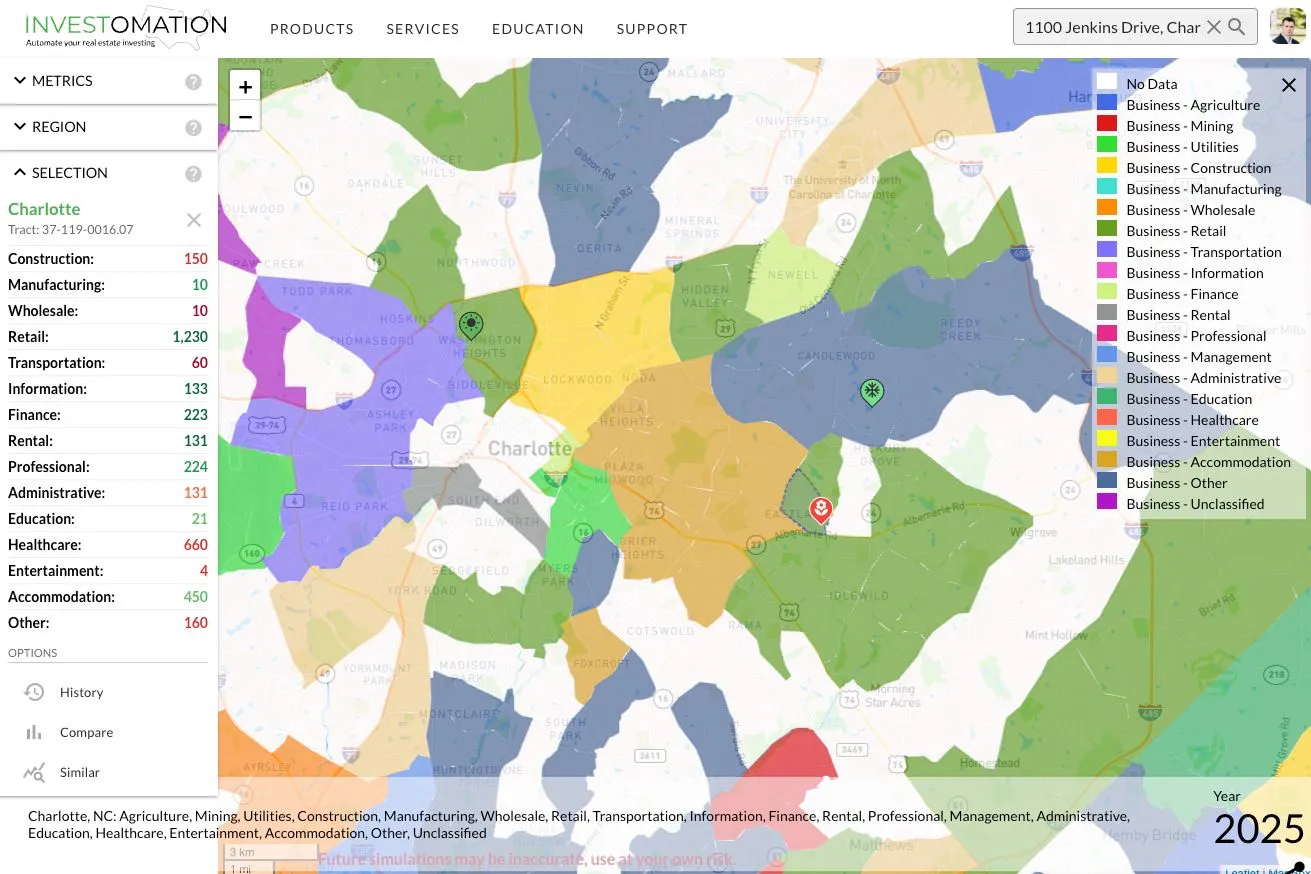 About 1,230 jobs in retail in the immediate area, close to the orange accommodation cluster.
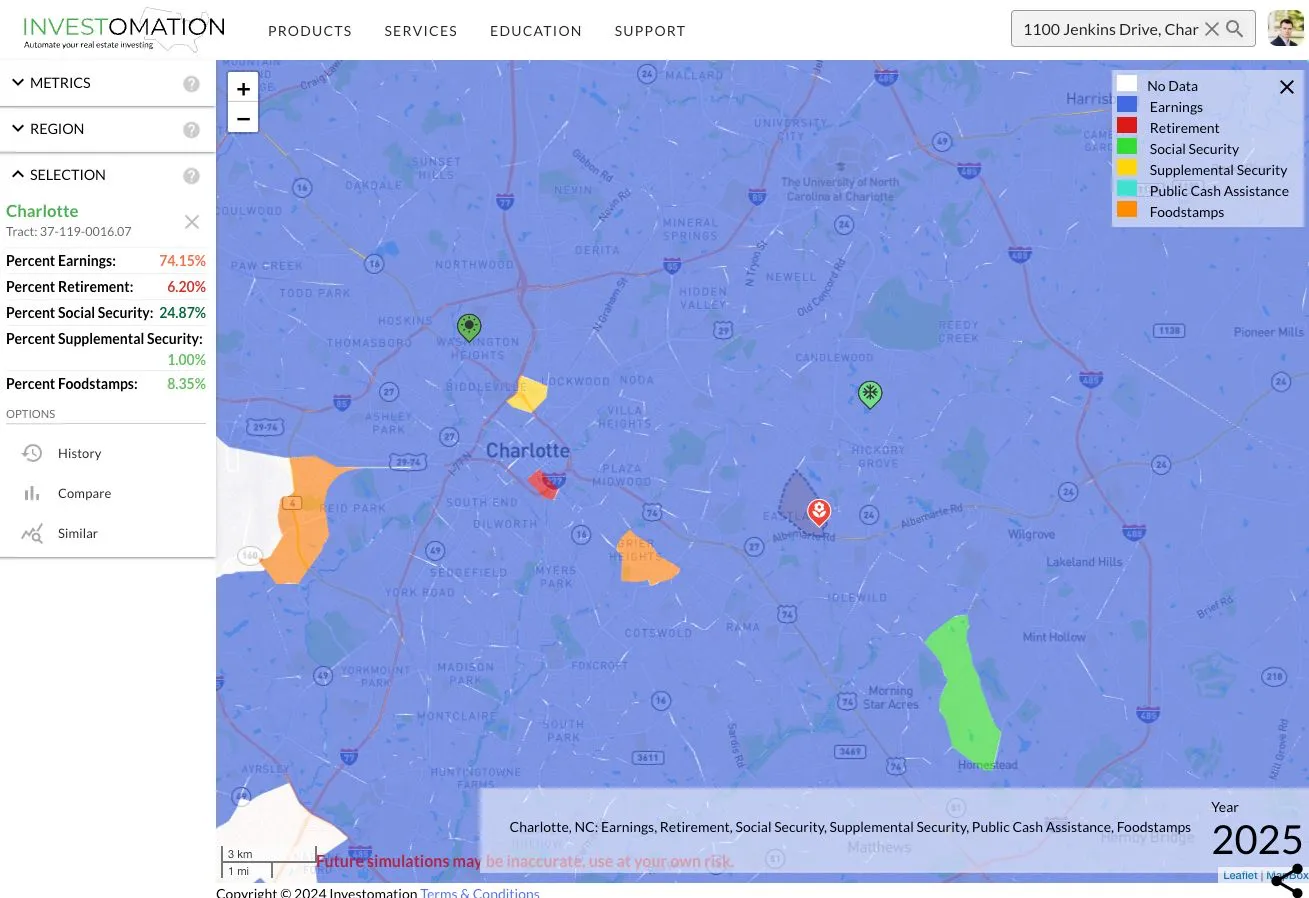 Income source distribution: most of it is earnings, with some Social Security and SNAP. Nothing alarming for the area, but worth knowing it's earnings-driven rather than transfer-driven; that's what makes price appreciation here possible at all.
For visual contrast, this is the same heatmap for Boston:
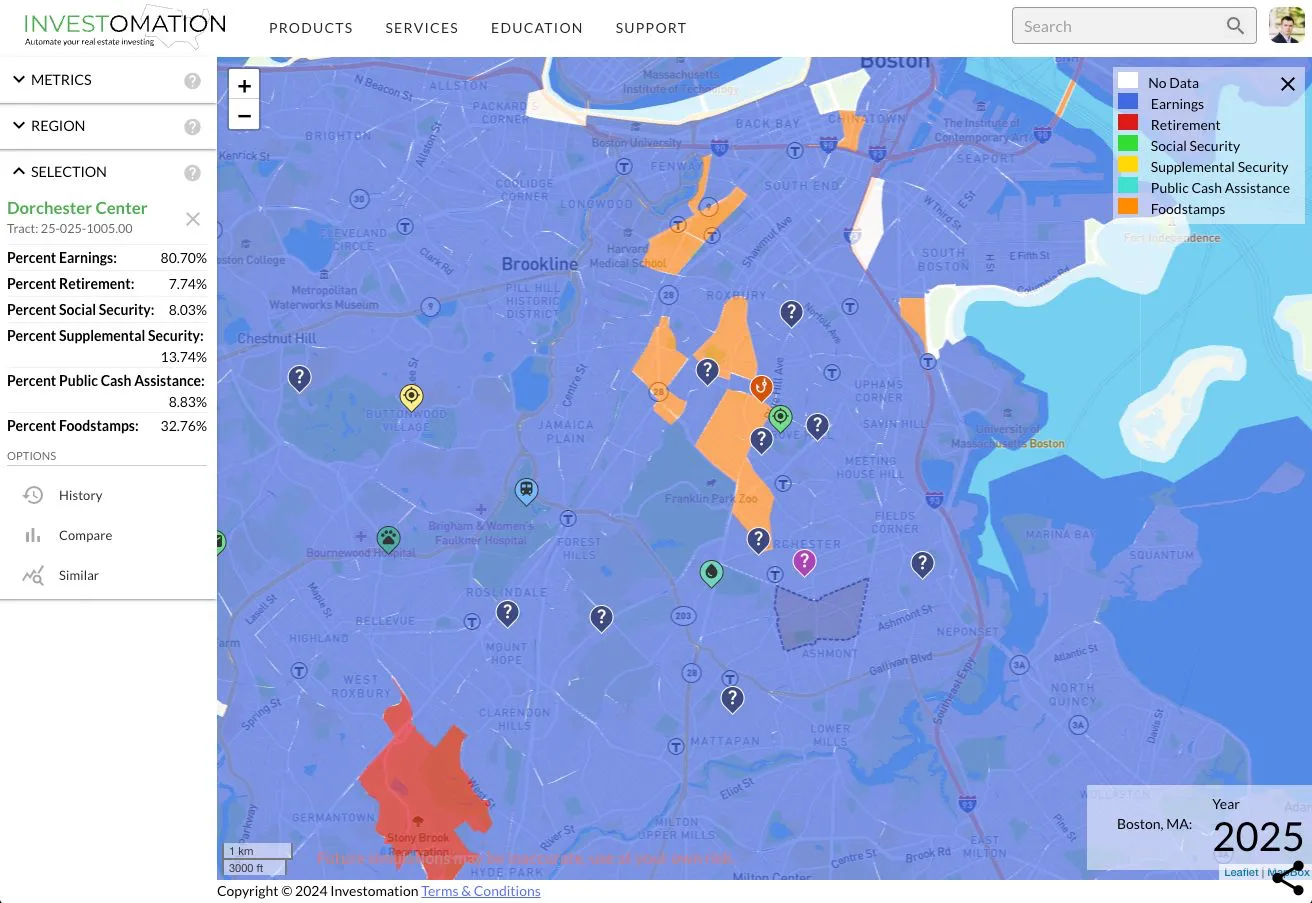 Boston has higher absolute income concentrations because it has to; the cost of living is much higher. But the tax-base trajectory is moving the wrong way, which is why I keep buying out of Boston rather than into it.
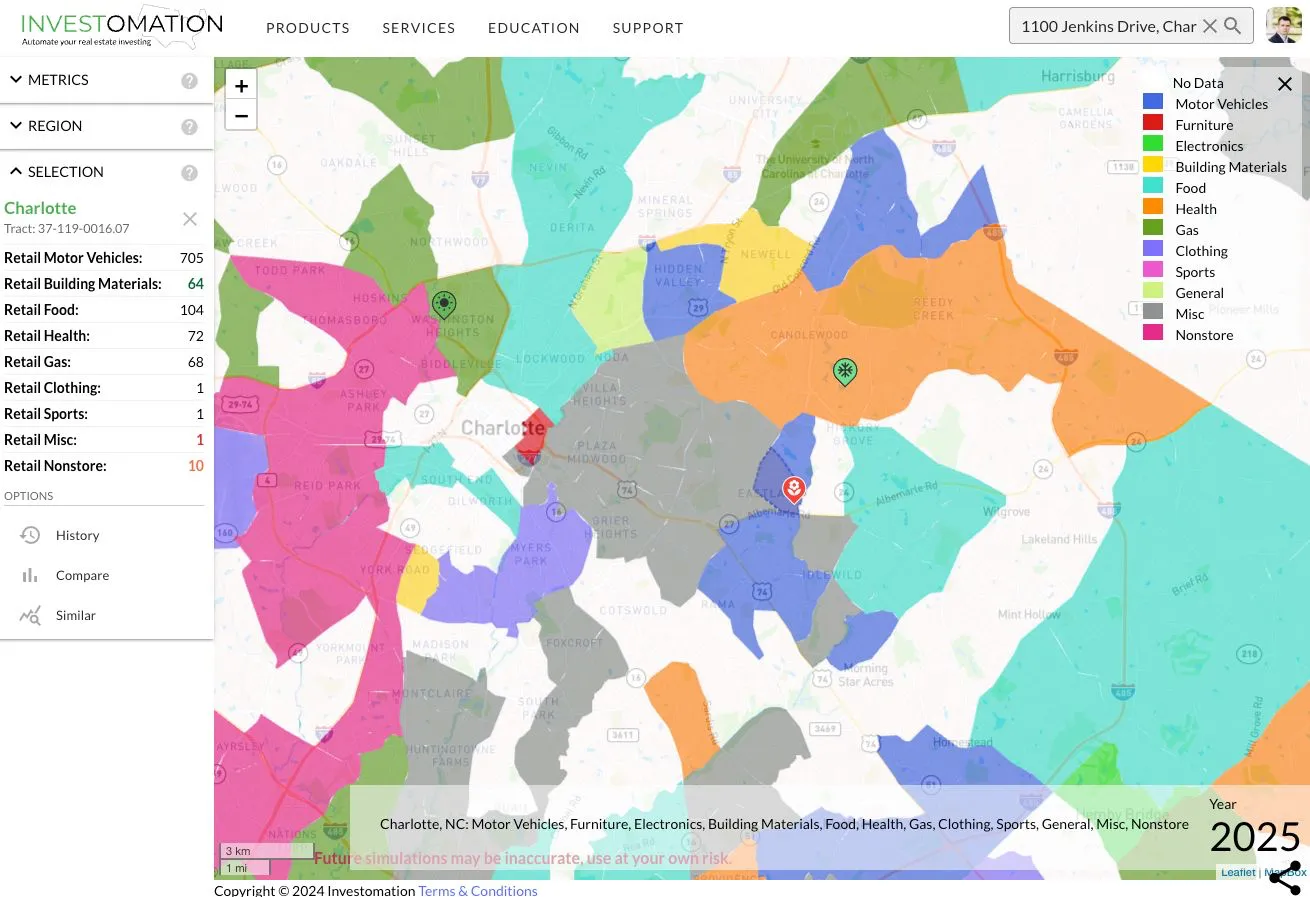 Drilling into retail in Property A's area, the dominant subsector is car sales. That's worth flagging. Car sales clusters tend to occupy commercial corridors with significant vehicle traffic, which is fine for accommodation demand (drivers are AirBnB customers too) but it's not the kind of walkable retail mix that justifies premium nightly rates on its own. The accommodation-and-rental hotspot proximity is doing more for the thesis than the retail mix is.
Points of interest
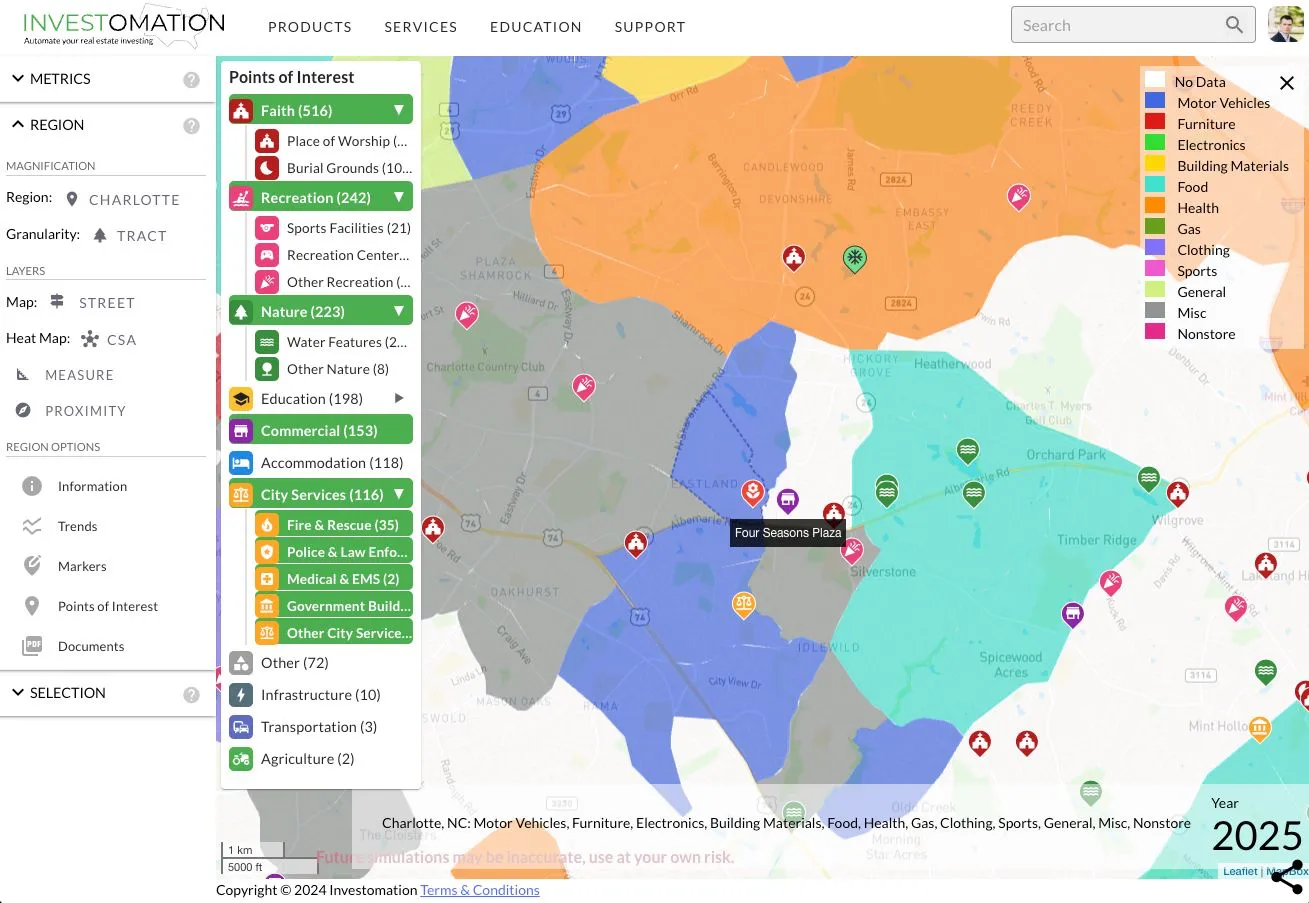 Nothing in this tract is a destination POI. The thesis isn't that Property A sits next to something tourists fly in for; it's that it sits at the intersection of an established short-term rental corridor and a tract that's getting rebuilt at the price point that supports new-construction nightly rates. POIs are confirmation rather than driver here. Our strategy for AirBnBs isn't to leverage existing amenities around us, but to create a destination spot capable of attracting large groups (homes capable of hosting large groups and holding their own in terms of entertainment currently command a premium on AirBnB).
Where this leaves us after day one
After day one, my read for the client was that Property A is a viable buy. The tract is mid-gentrification, adjacent to two established accommodation areas, on the path of the Silver Line east extension, and at a price point ($420k tract median, ~$500k for Property A's new construction) that the AirDNA comp data supports. The risks are honest: the demographic data is messy because the tract is being rebuilt; the immediate retail mix is car-sales-heavy; and there's a teenage population concentration that we'll have to manage with sound meters and good neighbor protocols. None of those are deal-breakers; they're operational concerns that get priced into management.
She wanted to compare it against a second candidate before deciding. We did that on day two. Part 2 walks through Property B and how the side-by-side ended up driving the actual recommendation, plus a closer look at the full concierge process from acquisition through management.
If you want this kind of underwriting run on a property you're considering, that's something we do directly. Investomation's panels are what you saw on screen above; the conversation around them is what we're paid for.
